Page 1
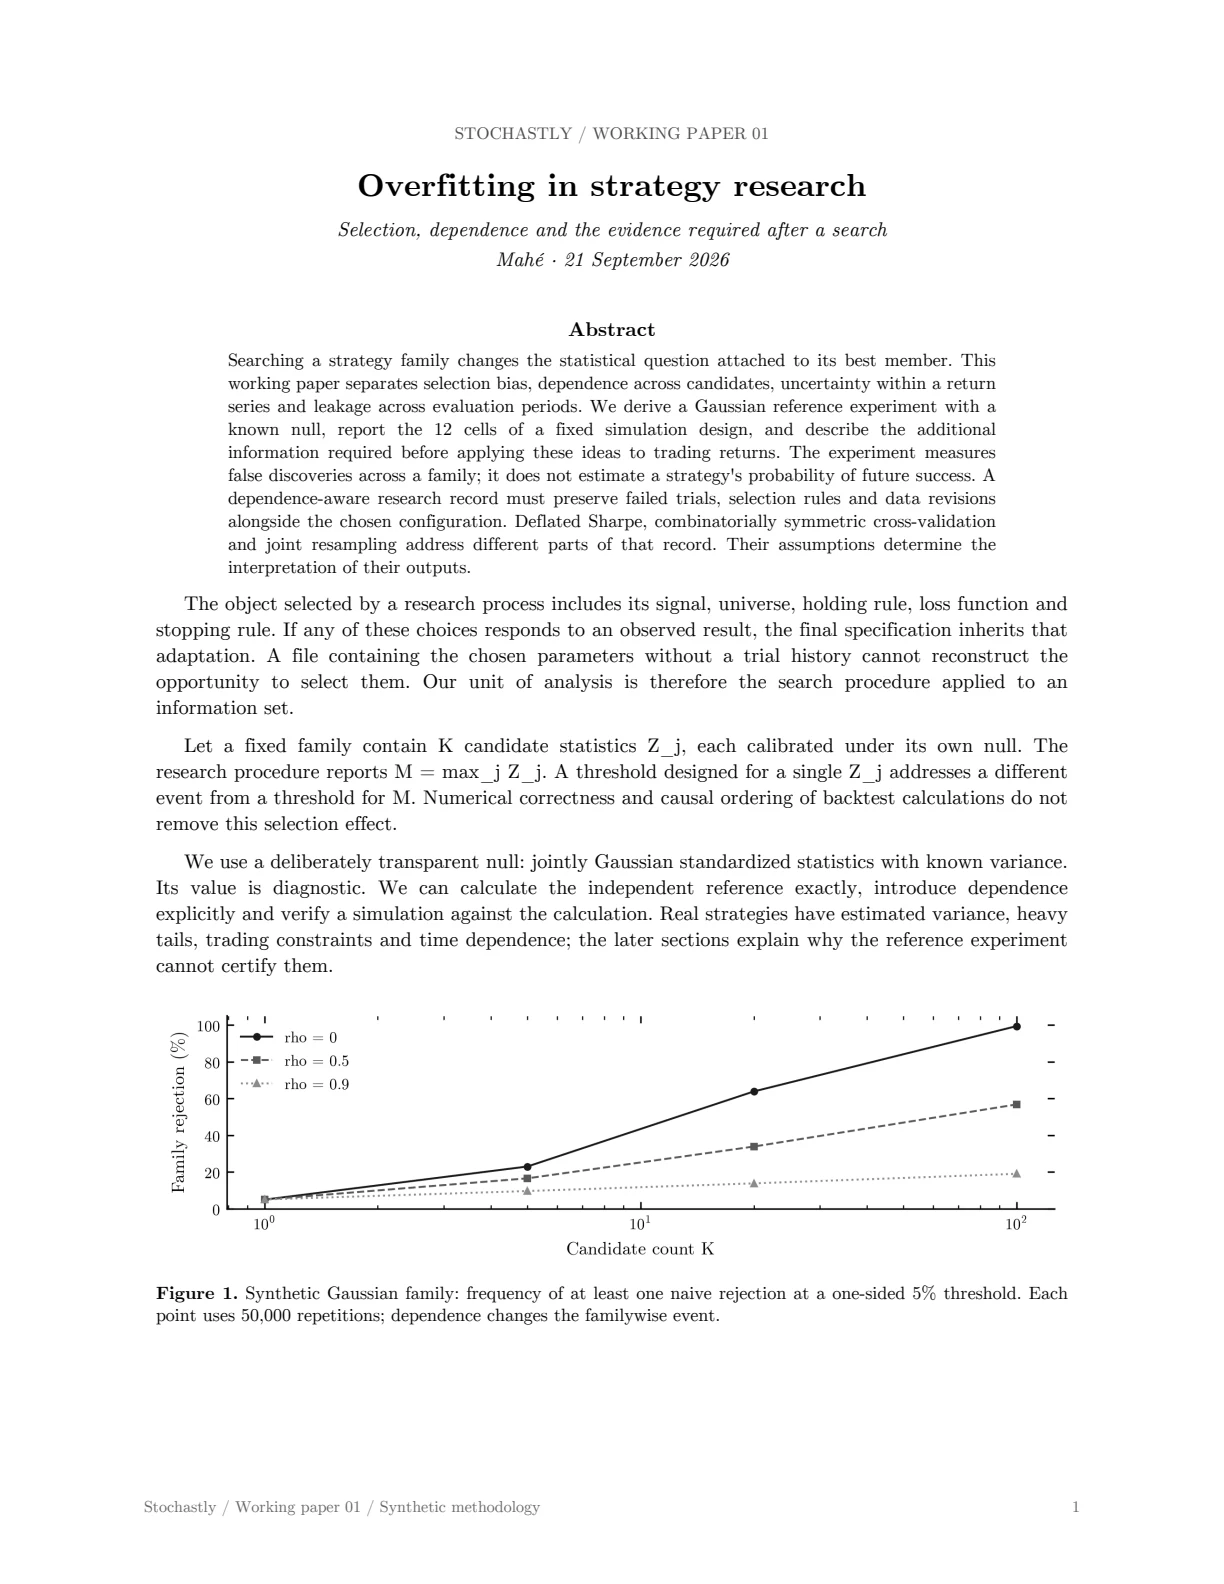
Stochastly / Working paper 01 / Synthetic methodology 1 STOCHASTLY / WORKING PAPER 01 Overfitting in strategy research Selection, dependence and the evidence required after a search Mahé · 21 September 2026 Abstract Searching a strategy family changes the statistical question attached to its best member. This working paper separates selection bias, dependence across candidates, uncertainty within a return series and leakage across evaluation periods. We derive a Gaussian reference experiment with a known null, report the 12 cells of a fixed simulation design, and describe the additional information required before applying these ideas to trading returns. The experiment measures false discoveries across a family; it does not estimate a strategy's probability of future success. A dependence-aware research record must preserve failed trials, selection rules and data revisions alongside the chosen configuration. Deflated Sharpe, combinatorially symmetric cross-validation and joint resampling address different parts of that record. Their assumptions determine the interpretation of their outputs. The object selected by a research process includes its signal, universe, holding rule, loss function and stopping rule. If any of these choices responds to an observed result, the final specification inherits that adaptation. A file containing the chosen parameters without a trial history cannot reconstruct the opportunity to select them. Our unit of analysis is therefore the search procedure applied to an information set. Let a fixed family contain K candidate statistics Z_j, each calibrated under its own null. The research procedure reports M = max_j Z_j. A threshold designed for a single Z_j addresses a different event from a threshold for M. Numerical correctness and causal ordering of backtest calculations do not remove this selection effect. We use a deliberately transparent null: jointly Gaussian standardized statistics with known variance. Its value is diagnostic. We can calculate the independent reference exactly, introduce dependence explicitly and verify a simulation against the calculation. Real strategies have estimated variance, heavy tails, trading constraints and time dependence; the later sections explain why the reference experiment cannot certify them. Figure 1. Synthetic Gaussian family: frequency of at least one naive rejection at a one-sided 5% threshold. Each point uses 50,000 repetitions; dependence changes the familywise event.
Page 2
Stochastly / Working paper 01 / Synthetic methodology 2 1. The selected maximum and the geometry of a family Under independent standard-normal null statistics, the distribution of M is the product of the marginal distributions. Choosing a familywise false-rejection probability alpha gives an exact reference cutoff. Both expressions follow directly from the event that all K coordinates fall below the same threshold. At alpha = 0.05, applying the ordinary one-sided threshold to 100 independent candidates produces at least one rejection with probability 1 - 0.95^100, approximately 99.41%. This is a statement about a family in which the K null hypotheses hold. This probability does not estimate the fraction of false published strategies or a posterior probability for a particular strategy. Independence is a strong assumption for a parameter grid. Moving a lookback by one bar can produce nearly identical positions. We introduce equicorrelation through a shared Gaussian component and idiosyncratic components. The marginal distribution remains standard normal while the family changes shape. For nonnegative rho below one, conditioning on the shared component gives a one-dimensional integral for the maximum's distribution. This offers a route to numerical calibration when the model is genuinely known. In empirical research, estimating the relevant dependence and its stability creates further uncertainty. The equicorrelated construction has no empirical catalogue calibration. The participation ratio of correlation eigenvalues, (sum lambda)^2 / sum lambda^2, summarizes spectral concentration. It equals K for an identity matrix and approaches one for nearly identical coordinates. It does not determine the tail of M: two families can share a spectral summary while differing in tail dependence. Substituting this number into an independent-test formula is a heuristic requiring calibration. The recorded family, or an explicitly modelled joint null, remains the statistical object. Equations in plain text (1) P(M <= z) = Phi(z)^K; c_alpha = inverse_Phi((1-alpha)^(1/K)). (2) Z_j = sqrt(rho) U + sqrt(1-rho) epsilon_j. U and epsilon_j are independent standard normal variables.
Page 3
Stochastly / Working paper 01 / Synthetic methodology 3 2. Return uncertainty and selection uncertainty A Sharpe estimate adds another estimation layer. Write s = mean(r) / sd(r) on the observation frequency, with skewness g3 and raw kurtosis g4. Under the regularity conditions of the probabilistic Sharpe approximation, a comparison against a reference s0 includes the non-Gaussian moment correction below [1]. Its reference and observation unit must be stated. The deflated Sharpe framework raises the reference to account for selection among trials [1]. It requires information about that search. Guessing an independent trial count from the number of surviving strategies discards the candidates that made selection possible. Treating a deflated statistic as a posterior probability of positive future returns adds an interpretation the calculation does not supply. Serial dependence changes the variance of an average. A long-run variance estimate includes weighted lag covariances; the bandwidth and kernel are modelling choices. Newey and West provide a positive-semidefinite heteroskedasticity-and-autocorrelation-consistent construction [3]. The expression below states the Bartlett-weighted scalar version, using sample autocovariances. It is a separate approximation from the Sharpe formula. The two corrections concern different mechanisms. A long-run standard error can make an individual statistic better calibrated while leaving the selection of its maximum untouched. Conversely, a correct familywise adjustment built from misspecified individual statistics can still reject too often. A complete analysis needs a joint procedure whose resampling or asymptotic argument addresses both layers. A product of adjusted probabilities requires a specific joint model. Such a product lacks a sampling interpretation unless a model establishes one. A defensible design names a primary decision rule in advance, records secondary diagnostics and checks that the primary procedure recovers injected signals. This makes contradictory diagnostics investigable without turning the final decision into another undocumented search. Degenerate series require explicit handling. Zero estimated variance, unstable fourth moments or a handful of independent return episodes can invalidate an approximation. Increasing displayed decimal places does not add information. The report should show the effective sample geometry and mark an unavailable statistic as unavailable. Equations in plain text (3) PSR(s0) = Phi((s_hat-s0) sqrt(T-1) / sqrt(1-g3_hat s_hat+(g4_hat-1) s_hat^2/4)). (4) omega_hat^2 = gamma_hat_0 + 2 sum from k=1 to L of (1-k/(L+1)) gamma_hat_k. SE(mean r) = sqrt(omega_hat^2/T).
Page 4
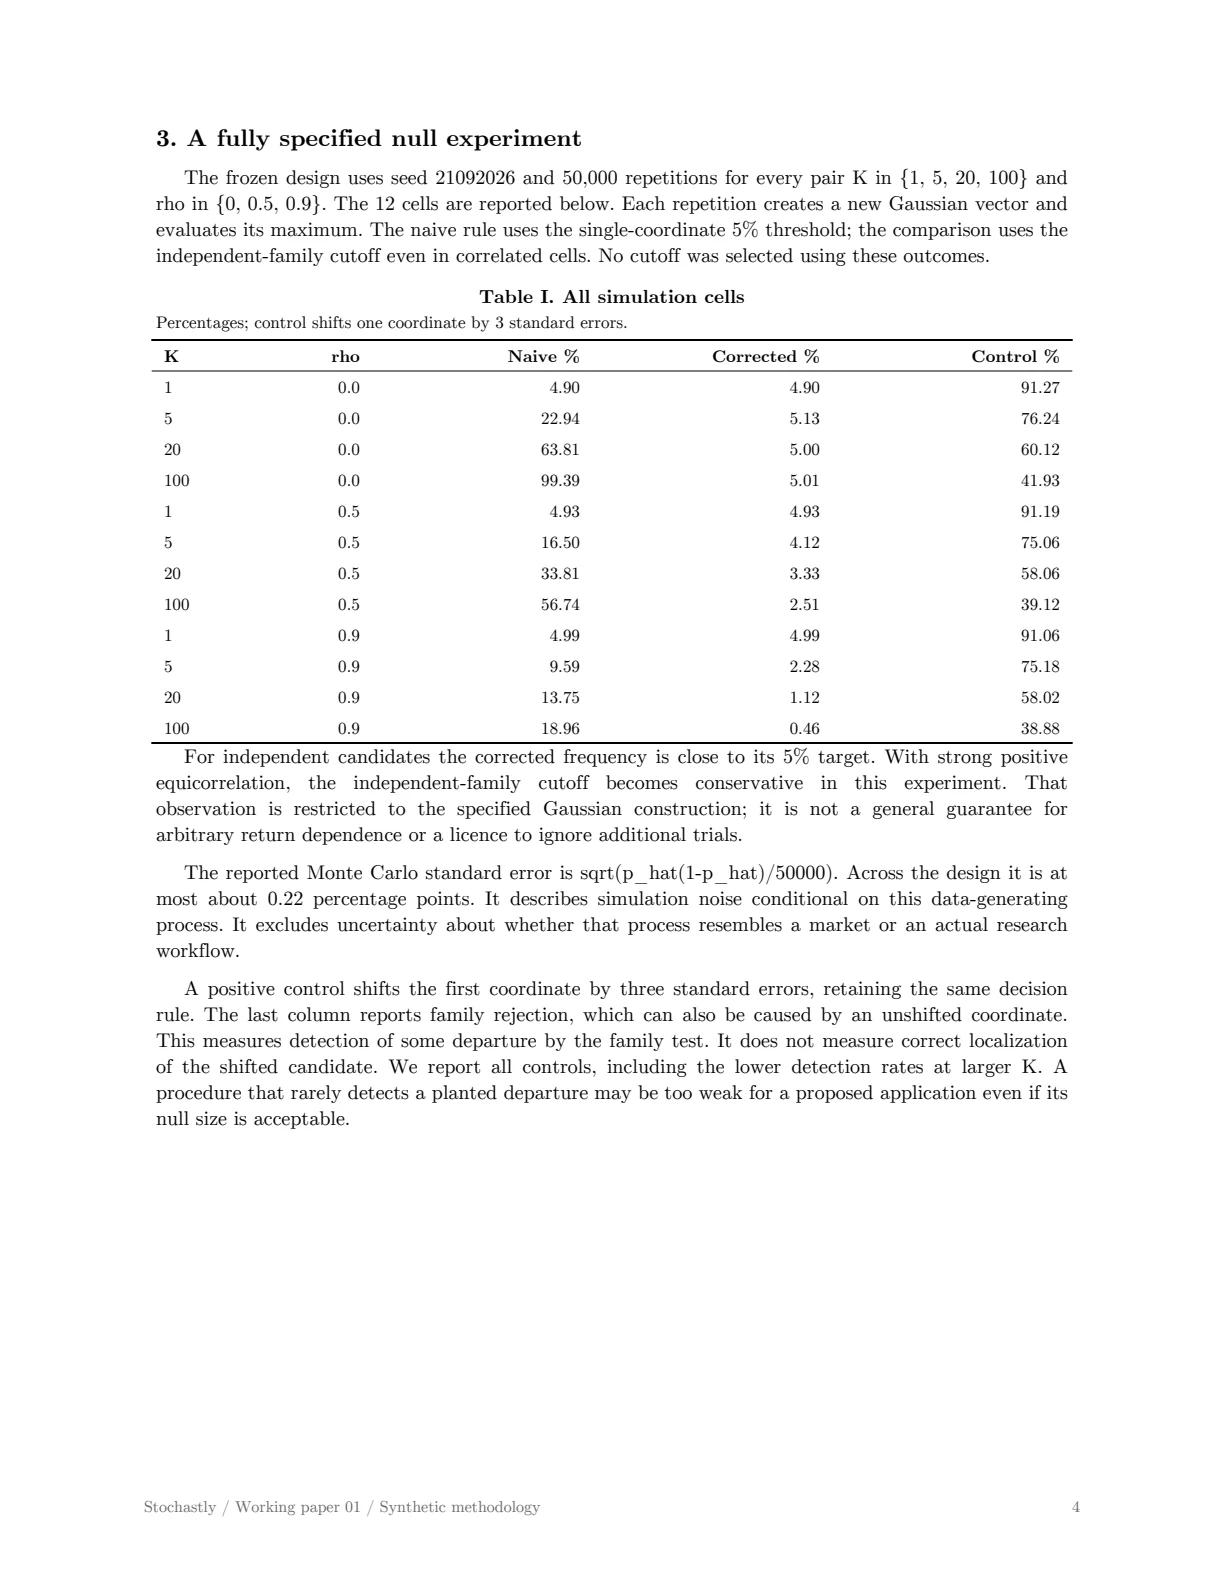
Stochastly / Working paper 01 / Synthetic methodology 4 3. A fully specified null experiment The frozen design uses seed 21092026 and 50,000 repetitions for every pair K in {1, 5, 20, 100} and rho in {0, 0.5, 0.9}. The 12 cells are reported below. Each repetition creates a new Gaussian vector and evaluates its maximum. The naive rule uses the single-coordinate 5% threshold; the comparison uses the independent-family cutoff even in correlated cells. No cutoff was selected using these outcomes. Table I. All simulation cells Percentages; control shifts one coordinate by 3 standard errors. K rho Naive % Corrected % Control % 1 0.0 4.90 4.90 91.27 5 0.0 22.94 5.13 76.24 20 0.0 63.81 5.00 60.12 100 0.0 99.39 5.01 41.93 1 0.5 4.93 4.93 91.19 5 0.5 16.50 4.12 75.06 20 0.5 33.81 3.33 58.06 100 0.5 56.74 2.51 39.12 1 0.9 4.99 4.99 91.06 5 0.9 9.59 2.28 75.18 20 0.9 13.75 1.12 58.02 100 0.9 18.96 0.46 38.88 For independent candidates the corrected frequency is close to its 5% target. With strong positive equicorrelation, the independent-family cutoff becomes conservative in this experiment. That observation is restricted to the specified Gaussian construction; it is not a general guarantee for arbitrary return dependence or a licence to ignore additional trials. The reported Monte Carlo standard error is sqrt(p_hat(1-p_hat)/50000). Across the design it is at most about 0.22 percentage points. It describes simulation noise conditional on this data-generating process. It excludes uncertainty about whether that process resembles a market or an actual research workflow. A positive control shifts the first coordinate by three standard errors, retaining the same decision rule. The last column reports family rejection, which can also be caused by an unshifted coordinate. This measures detection of some departure by the family test. It does not measure correct localization of the shifted candidate. We report all controls, including the lower detection rates at larger K. A procedure that rarely detects a planted departure may be too weak for a proposed application even if its null size is acceptable.
Page 5
Stochastly / Working paper 01 / Synthetic methodology 5 4. Evaluating the entire research procedure Joint resampling can preserve the observed cross-candidate structure by resampling aligned rows of a candidate-return matrix. A block scheme also preserves within-block temporal structure. Under a centred null, every replicate must repeat the declared ranking and any performance-dependent filter. Resampling the selected winner in isolation conditions away the search that produced it. For a single maximum statistic, an empirical p-value can use (1 + exceedances)/(B + 1), with the observed and resampled statistics computed by the same pipeline. Its resolution depends on B. The interpretation still depends on the null construction, centring, stationarity assumptions and block-length choice. A block bootstrap does not automatically preserve regime transitions or rare liquidity events. Romano-Wolf stepdown procedures extend joint resampling to multiple individual hypotheses while accounting for dependence under their stated conditions [4]. A single-step maximum test and a stepdown family of adjusted p-values are distinct outputs. The scientific report should identify the implemented procedure, the alternatives and the studentization rule. The label bootstrap alone leaves these distinctions unspecified. Combinatorially symmetric cross-validation evaluates the out-of-sample relative rank of an in-sample winner over complementary splits [2]. With ranks ordered by increasing performance, a normalized rank below 0.5 indicates a below-median outcome. The distribution of rank logits summarizes instability of selection. It concerns relative performance within the declared family, and is not the same event as rejecting a mean-return null. Small candidate families give coarse ranks; overlapping splits give dependent outcomes. The number of splits must not be reported as the number of independent market histories. A useful report includes the family size, number and duration of time blocks, ties policy and sensitivity to the partition. Diagnostic disagreement can reveal a weak family, an unstable winner or a mismatch between metrics. Finally, a sealed chronological evaluation is exposed once, under a recorded protocol. Reading it and revising the model converts it into development data. A new untouched period, or an explicitly adjusted sequential procedure, is then needed for a fresh confirmatory claim. Archiving the previous result remains essential even if the strategy name changes.
Page 6
Stochastly / Working paper 01 / Synthetic methodology 6 5. Reproducibility, scope and references The accompanying experiments.py contains the complete simulation, temporal audit and execution example for this journal series. results.json records the 12 configured cells and the hash of the protocol frozen before the run. Reproduction requires NumPy and SciPy; their measured versions are included in that file. The manuscripts and figures use rounded views of the recorded outputs. No market prices, fitted trading model, proprietary signal or investor record was used. This design isolates family selection under a known null. It does not implement a full dependent-return bootstrap, estimate a deflated Sharpe for a market strategy, or measure the predictive accuracy of a research agent. Those are separate empirical tasks. The experiments are generated by a standalone reproducibility script; Stochastly's existing paper rendering primitives supply the document typography, equations and figure layout. This authored methodological working paper contains no backtest exported from an application run. Before using a similar procedure on a strategy search, retain point-in-time data provenance, all attempted variants, feature-fit boundaries, execution assumptions and the exact selection code. Include a null calibration and a positive control at economically relevant effect sizes. Record test direction, dependence model and stopping rule. A replay should reproduce the selected candidate and its adjusted statistic, including rejected or failed branches that were part of the decision process. The supported conclusion has a limited scope: selection materially changes the null distribution, and dependence changes that distribution again. A complexity penalty detached from the actual research path cannot reconstruct missing trials. This motivates keeping the research record as a first-class artifact alongside the final strategy. References [1] Bailey, D. H. and Lopez de Prado, M. (2014). The Deflated Sharpe Ratio: Correcting for Selection Bias, Backtest Overfitting, and Non-Normality. https://www.davidhbailey.com/dhbpapers/deflated-sharpe.pdf [2] Bailey, D. H., Borwein, J. M., Lopez de Prado, M. and Zhu, Q. J. (2015). The Probability of Backtest Overfitting. https://www.davidhbailey.com/dhbpapers/backtest-prob.pdf [3] Newey, W. K. and West, K. D. (1987). A Simple, Positive Semi-Definite, Heteroskedasticity and Autocorrelation Consistent Covariance Matrix. https://www.nber.org/papers/t0055 [4] Romano, J. P. and Wolf, M. (2005). Stepwise Multiple Testing as Formalized Data Snooping. https://doi.org/10.1111/j.1468-0262.2005.00615.x Research disclosures Methodological working paper; not peer reviewed. AI-assisted drafting and computation prepared for Mahe's review. All numerical experiments are synthetic. No investment recommendation, validated strategy, live performance or future-return claim is made. Model assumptions and omitted empirical validations are stated in the text.