In-sample vs out-of-sample testing
by Mahé Chadeffaud, founder of Stochastly
How much of the price history should stay out of sample, and when can it be reused?
Common practice keeps the most recent 20 to 30 percent of the history aside, with enough trades in it to estimate performance. Each look at it followed by a change to the strategy turns that period into design data and counts as a trial.
The 20 to 30 percent share is a common convention with no theoretical optimum; the number of trades in the holdout matters more.
In-sample data is used to design and tune a strategy. Out-of-sample data is kept aside to test it once the design is fixed.
Why the split matters
A strategy tends to look better on the data used to build it. The out-of-sample result is the estimate of how it behaves on new data, as long as that data had no influence on the design.
“A backtest is realistic when the IS performance is consistent with the OOS performance.”
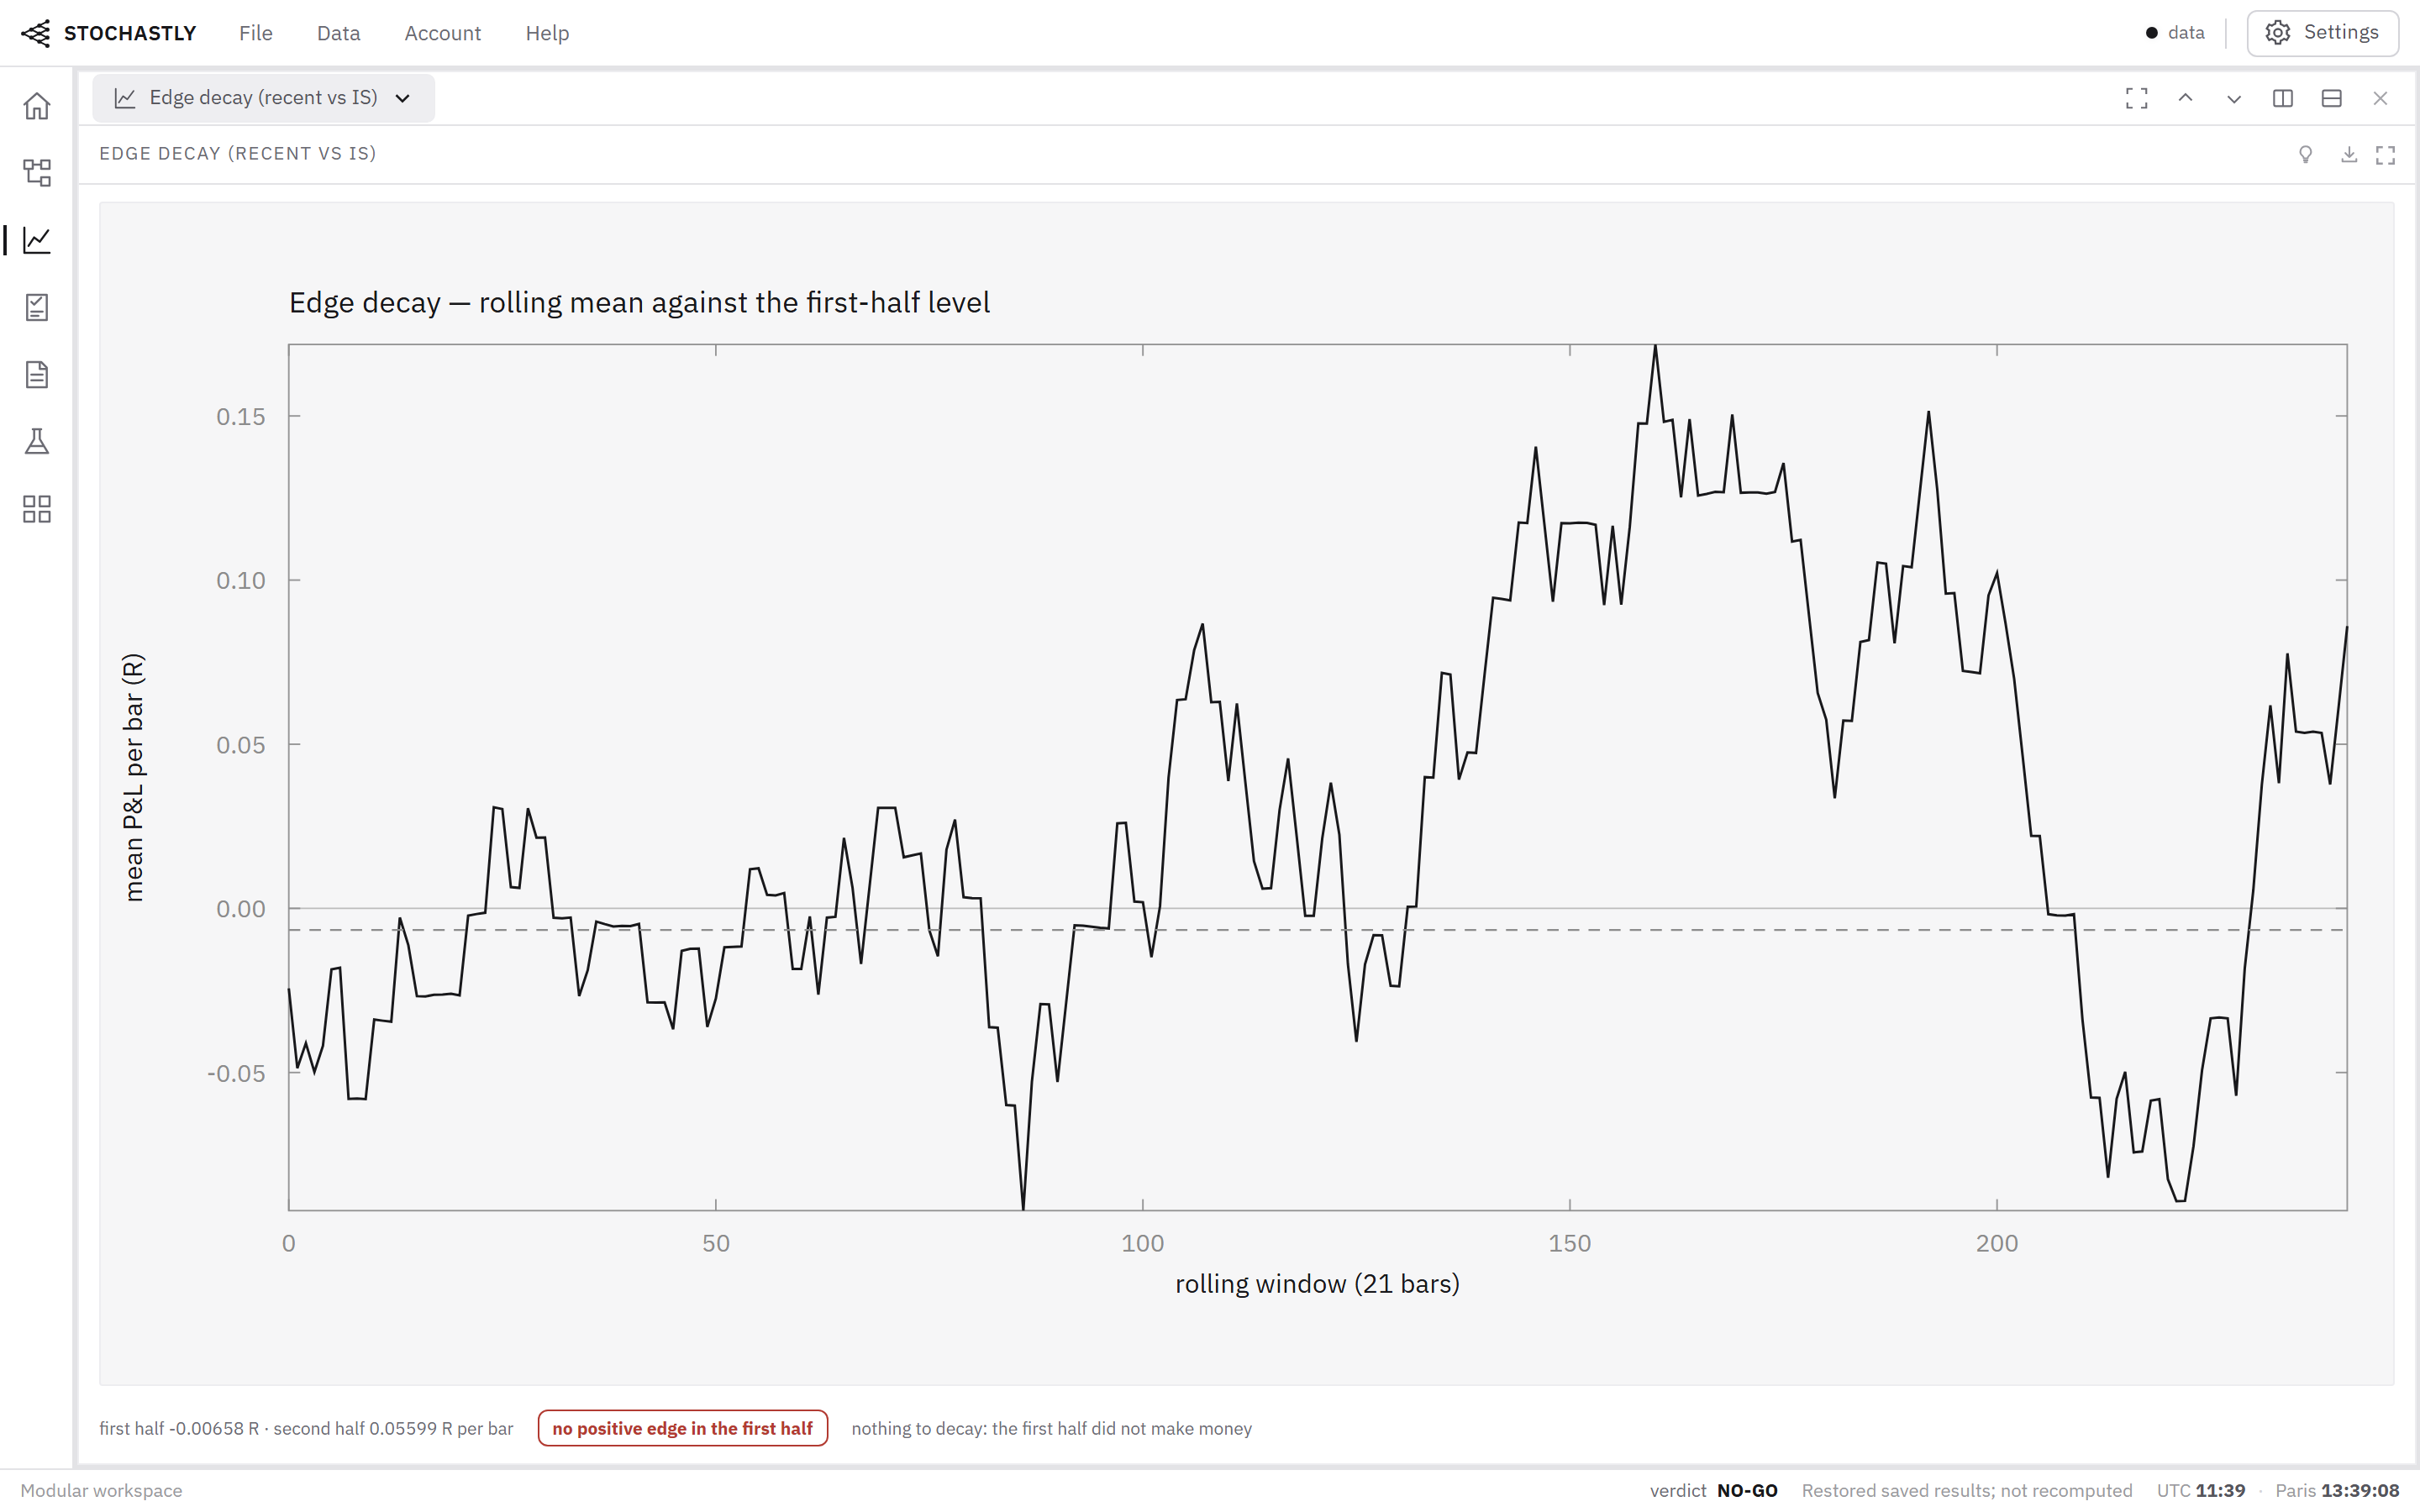 Open full size
How to split
Keep the most recent period as out-of-sample, since markets change over time. Walk-forward analysis repeats the split on successive windows, and purged cross-validation removes observations near the boundary so that overlapping labels do not leak across it.
Common leaks
Looking at out-of-sample results and then adjusting the strategy turns the test period into design data. Normalizing features on the full series, or choosing the universe with knowledge of the test period, also leaks information.
“Researchers have lived through the hold-out sample and thus understand the history, are knowledgeable about when markets rose and fell, and associate leading variables with past experience.”
A worked split
Take ten years of daily data. Design and tune on the first seven and a half years, then run the frozen strategy once on the last two and a half. For independent daily returns, the standard error of an annualized Sharpe ratio near zero over 2.5 years is about 1 / sqrt(2.5) = 0.63. An out-of-sample Sharpe of 0.5 is therefore still compatible with no edge at the 95 % level, and a Sharpe of 1.5 is not. Write that threshold down before the single run.
If the strategy trades twice a month, the holdout contains about 60 trades. That is enough to compare the average trade with the in-sample period, and too few to judge rare events such as a gap through a stop.
Frequently asked questions
How much data should be out-of-sample?
Common splits keep 20 to 30 % of the history out of sample, with enough trades in that period to estimate performance.
Can I reuse out-of-sample data?
Each reuse after seeing the results makes it part of the design. Count those looks as trials, or keep a final holdout that is used once.
Sources
Bailey, Borwein, López de Prado and Zhu (2014). Pseudo-Mathematics and Financial Charlatanism: The Effects of Backtest Overfitting on Out-of-Sample Performance. Notices of the American Mathematical Society 61(5), 458-471.
Arnott, Harvey and Markowitz (2019). A Backtesting Protocol in the Era of Machine Learning. Journal of Financial Data Science 1(1), 64-74.
Bailey, Borwein, López de Prado and Zhu (2017). The Probability of Backtest Overfitting. Journal of Computational Finance 20(4), 39-69.
Brown, Goetzmann, Ibbotson and Ross (1992). Survivorship Bias in Performance Studies. Review of Financial Studies 5(4), 553-580.
In the library
Nothing Beats the Historical Mean Out of Sample, Except Under Constraints
Feature importance: MDA vs MDI + SHAP
"Real" and "tradable" are two separate verdicts, and cost is what separates them