Probability of backtest overfitting (PBO)
by Mahé Chadeffaud, founder of Stochastly
What does a PBO score of 0.6 mean for the way a strategy configuration was chosen?
In 60 percent of the CSCV splits, the configuration ranked first on the in-sample blocks finished below the median of all candidates on the held-out blocks. Picking the in-sample winner did worse than picking a configuration at random.
PBO estimates the probability that the configuration which looked best in sample ranks below the median out of sample.
The idea
When a researcher tests many configurations and keeps the best one, the selection itself can be overfit. PBO, introduced by Bailey, Borwein, López de Prado and Zhu, measures how often that selection fails on data it did not use.
 Open full size
How it is computed: CSCV
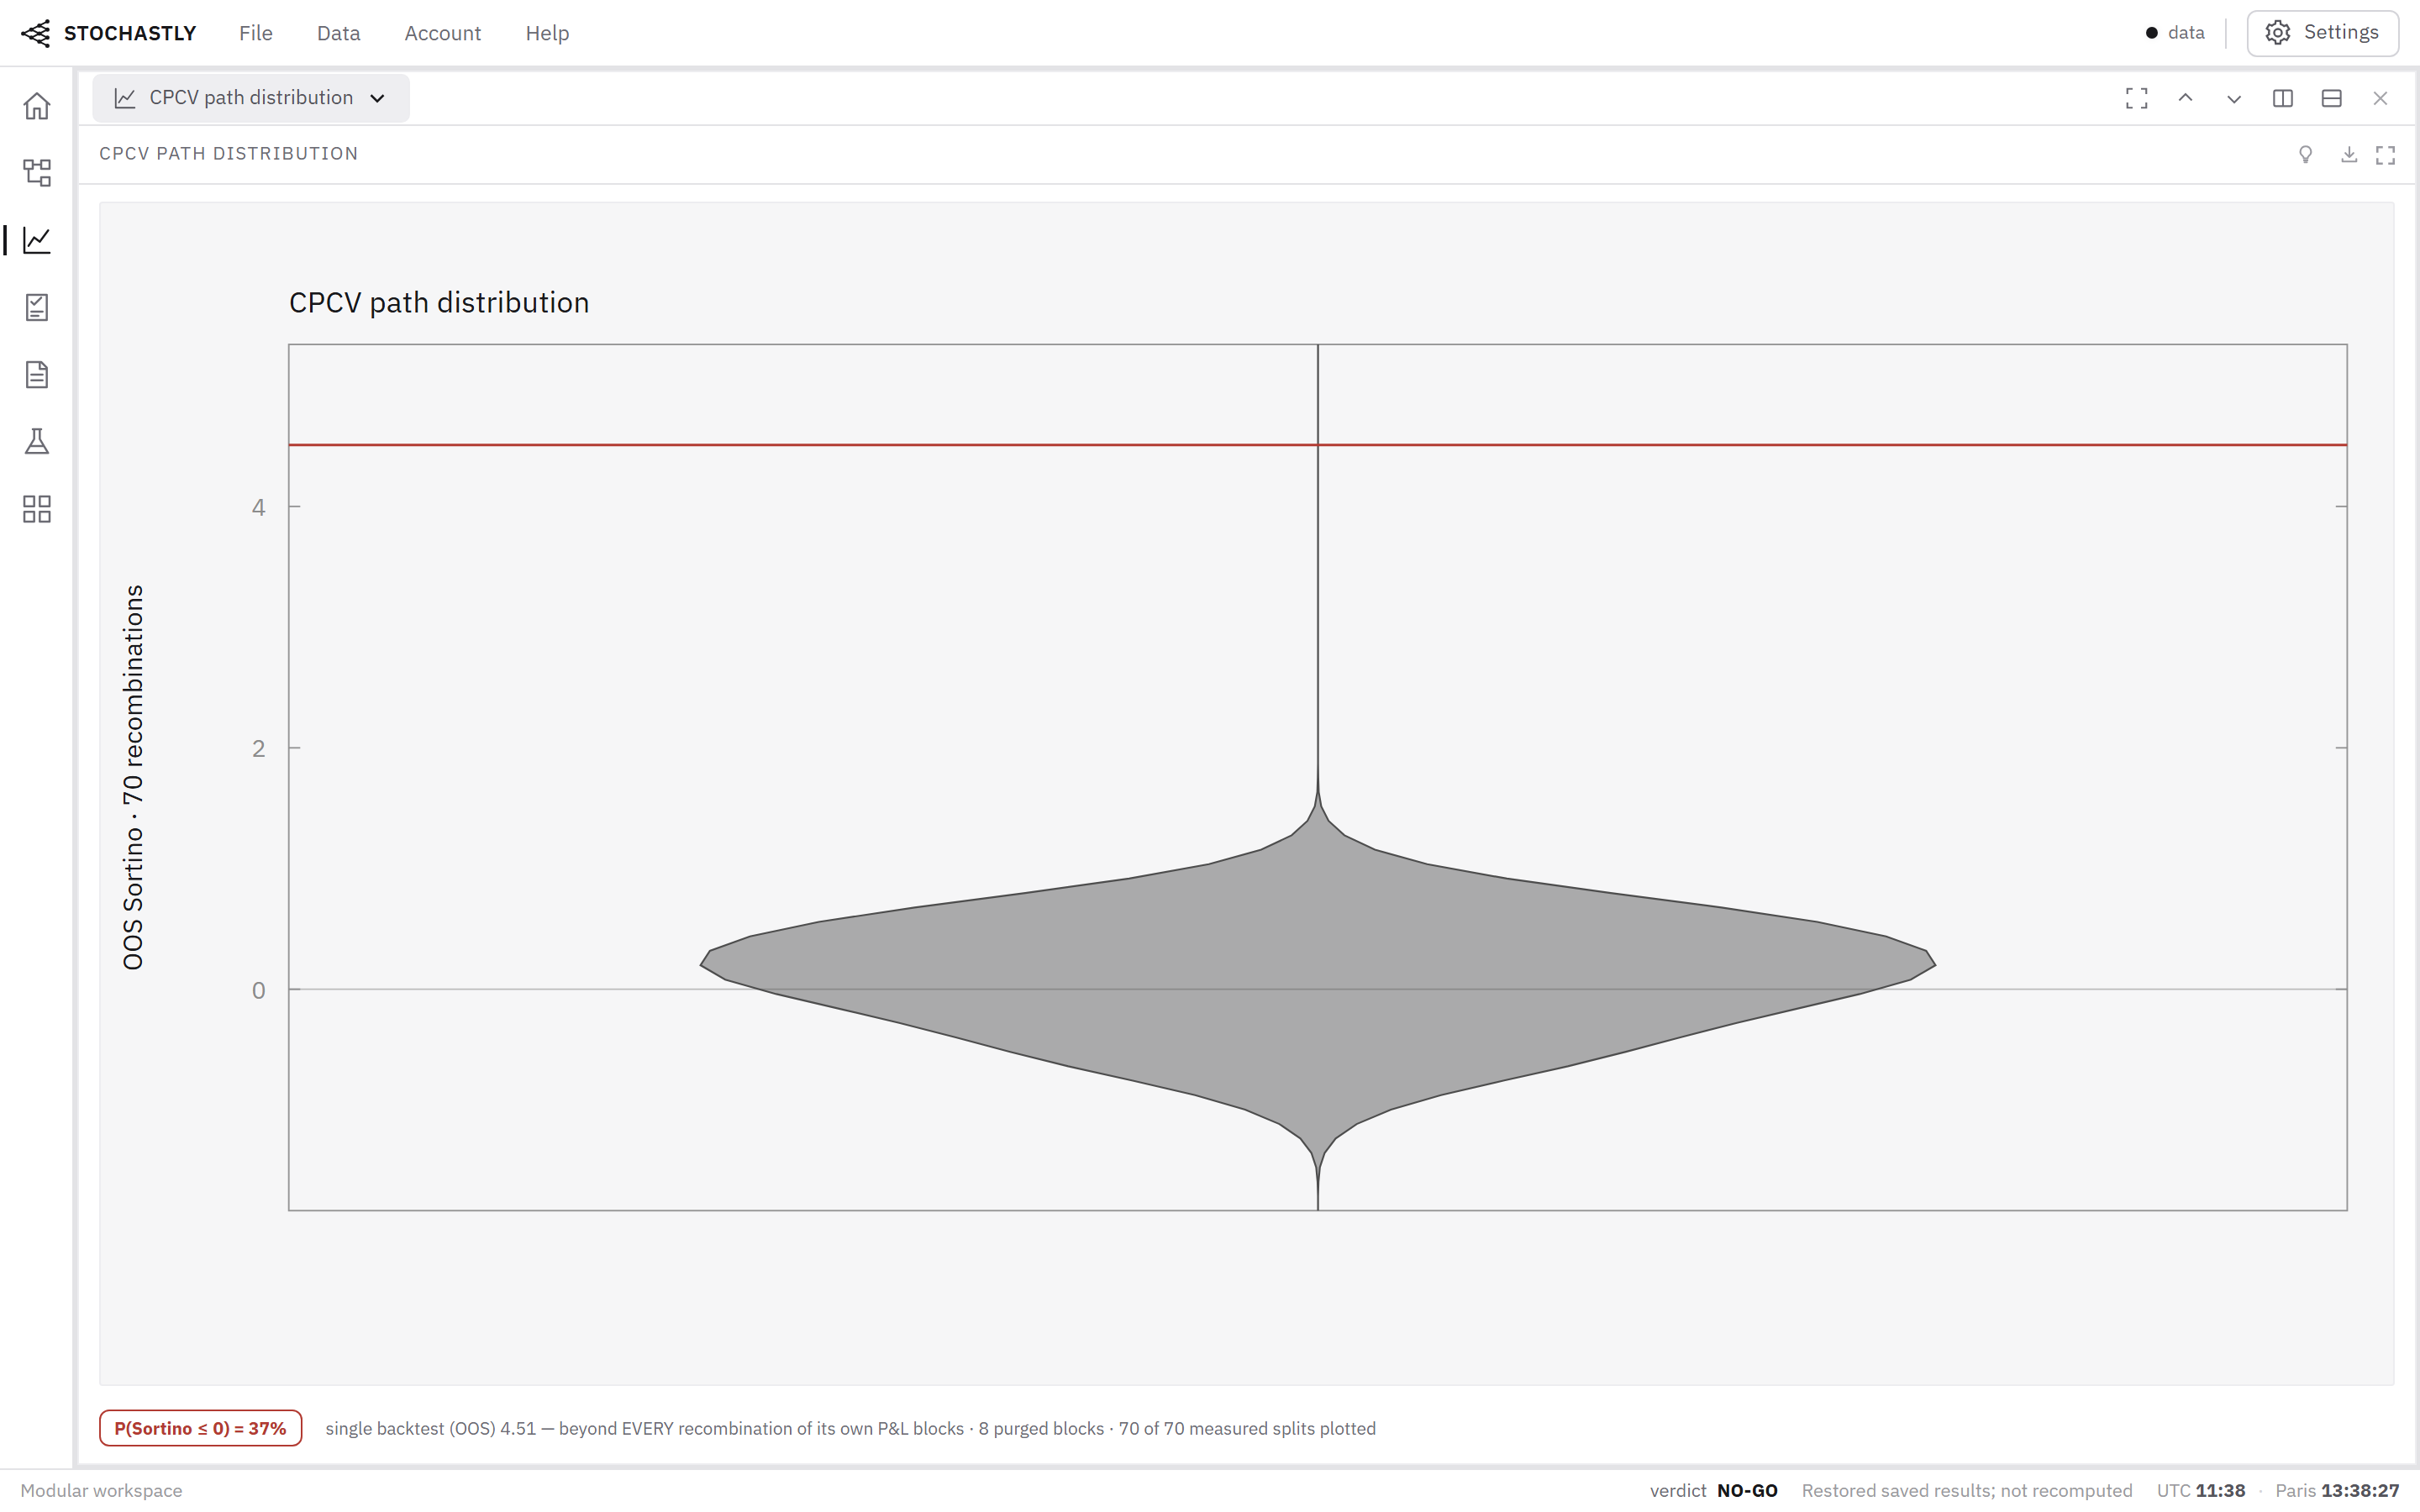
Combinatorially symmetric cross-validation splits the matrix of returns of all configurations into S blocks of time. For each way of choosing half of the blocks as in-sample, the best configuration in sample is located, and its rank among all configurations on the remaining blocks is recorded.
Each rank is turned into a logit. PBO is the share of combinations where the logit is below zero, meaning the in-sample winner landed in the bottom half out of sample.
When several configurations tie for the best in-sample score, Stochastly counts the combination as the average over the tied winners, the expected value of picking one of them at random. Identical configurations are counted once.
λ = ln(ω / (1 − ω)), PBO = share of combinations with λ < 0“We illustrate this framework with specific generic, model-free and nonparametric implementations in the context of investment simulations; we call these implementations combinatorially symmetric cross-validation (CSCV).”
Reading the score
A PBO close to 0 means the selection process tends to pick configurations that hold up. A PBO around 0.5 means picking the in-sample winner does no better than picking at random. Above 0.5, the selected configurations tend to do worse out of sample.
PBO judges the search process, so it needs several configurations. With a small number of configurations its estimate is noisy.
Frequently asked questions
What does a PBO of 0.5 mean?
The best configuration in sample has even odds of falling below the median out of sample: the selection adds no information.
What is a good PBO?
Lower is better. Values well below 0.5 across several splits indicate that the choice of configuration generalizes.
Is PBO the same as the deflated Sharpe ratio?
No. PBO evaluates the ranking of many configurations; the deflated Sharpe ratio corrects one Sharpe ratio for the number of trials. They answer related questions and are often reported together.
Sources
Bailey, Borwein, López de Prado and Zhu (2014). Pseudo-Mathematics and Financial Charlatanism: The Effects of Backtest Overfitting on Out-of-Sample Performance. Notices of the American Mathematical Society 61(5), 458-471.
Bailey, Borwein, López de Prado and Zhu (2017). The Probability of Backtest Overfitting. Journal of Computational Finance 20(4), 39-69.
Bailey and López de Prado (2014). The Deflated Sharpe Ratio: Correcting for Selection Bias, Backtest Overfitting, and Non-Normality. Journal of Portfolio Management 40(5), 94-107.
Bailey and López de Prado (2012). The Sharpe Ratio Efficient Frontier. Journal of Risk 15(2), 3-44.
Harvey, Liu and Zhu (2016). … and the Cross-Section of Expected Returns. Review of Financial Studies 29(1), 5-68.
Primary source for Probability of backtest overfitting (PBO)
In the library
Probability of Backtest Overfitting (PBO / CSCV)