Deflated Sharpe ratio
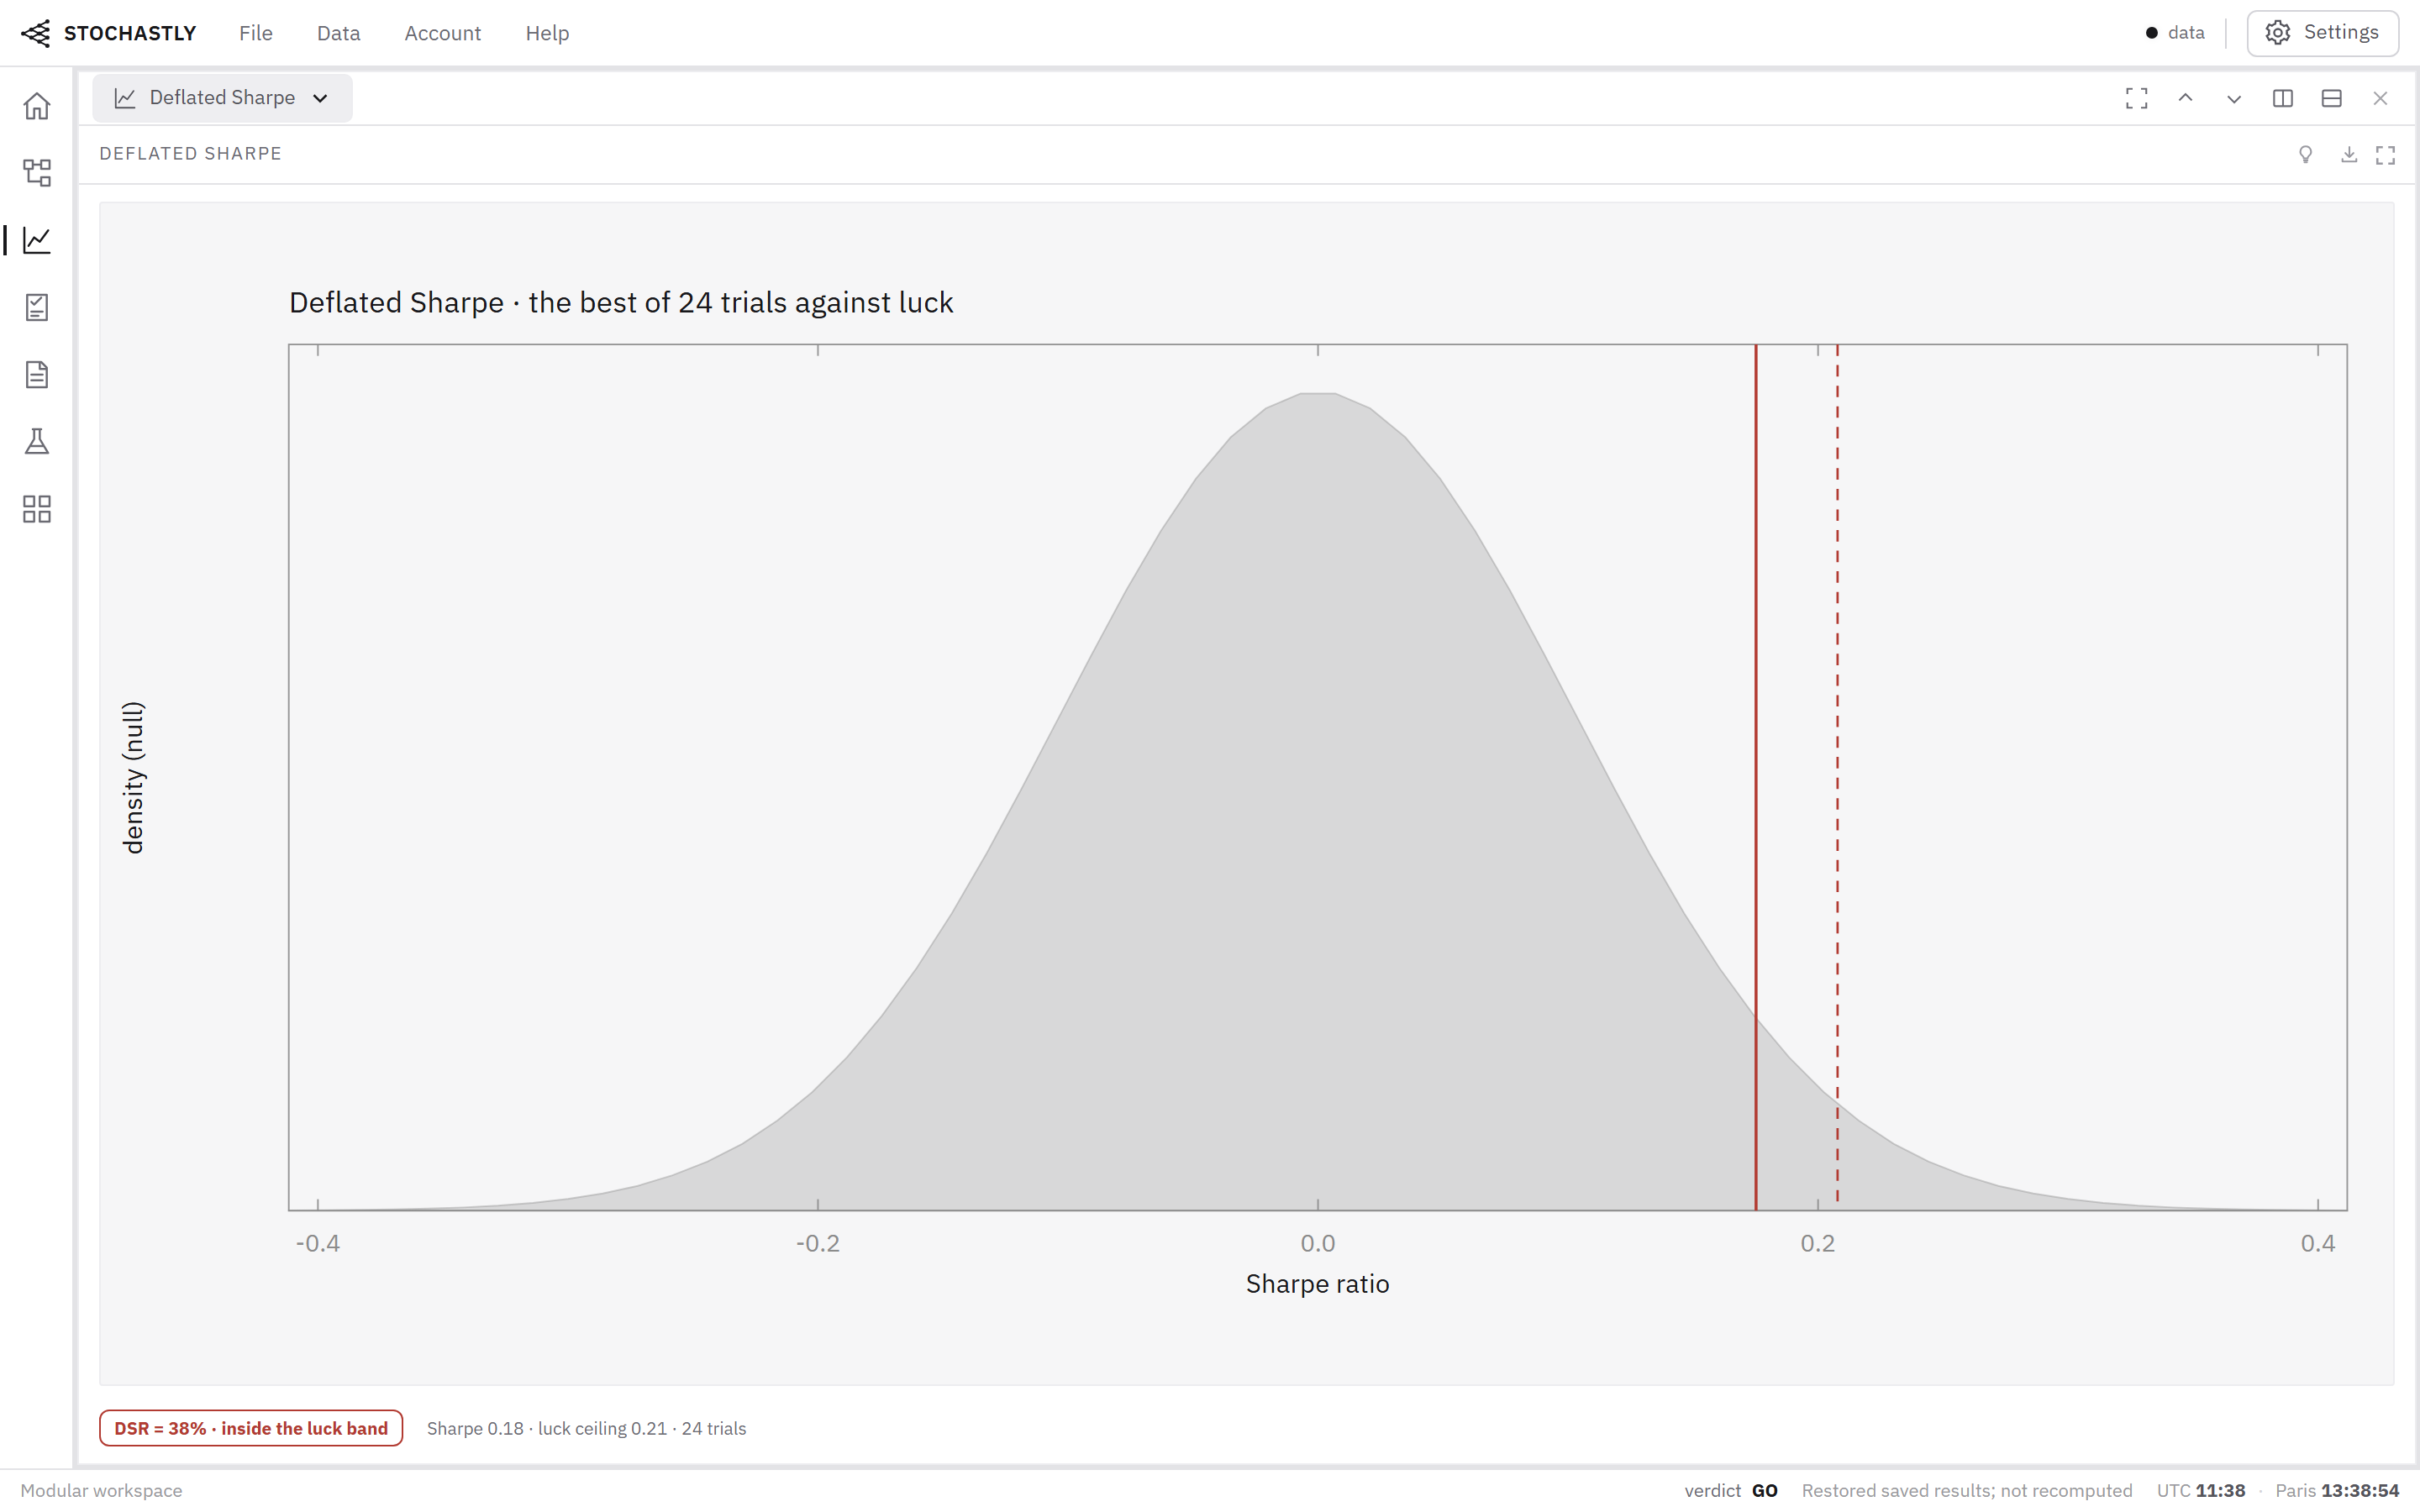
The deflated Sharpe ratio gives the probability that a strategy's true Sharpe ratio is positive, after accounting for the number of strategies tried and for non-normal returns.
The problem it solves
The Sharpe ratio of the best of many backtests is biased upward: some of the variants were bound to look good by chance. Fat tails and skewed returns make a given Sharpe ratio less reliable still.
“The Deflated Sharpe Ratio (DSR) corrects for two leading sources of performance inflation: Selection bias under multiple testing and non-Normally distributed returns.”
 Open full size
The probabilistic Sharpe ratio
The probabilistic Sharpe ratio (PSR) gives the probability that the true Sharpe ratio exceeds a benchmark SR*, from the observed Sharpe ratio, the number of observations T, the skewness γ3 and the kurtosis γ4 of returns.
PSR(SR*) = Φ( (SR − SR*) · sqrt(T − 1) / sqrt(1 − γ3 · SR + (γ4 − 1) / 4 · SR²) )“We evaluate the probability that an estimated Sharpe ratio exceeds a given threshold in presence of non-Normal returns.”
Deflating for the number of trials
The deflated Sharpe ratio (DSR) is the PSR evaluated at a benchmark equal to the Sharpe ratio expected from the best of N trials with no skill. The more trials, the higher that benchmark.
SR* = sqrt(V[SR]) · ((1 − γ) · Φ⁻¹(1 − 1/N) + γ · Φ⁻¹(1 − 1/(N·e))), γ ≈ 0.5772Reading it
A DSR close to 1 means the Sharpe ratio is unlikely to come from the search alone. A DSR near 0.5 or below means the result is compatible with luck given the number of trials. The count of trials includes each variant tried, including those discarded early.
Frequently asked questions
What is a good deflated Sharpe ratio?
It is a probability. Values above 0.95 are a common threshold for significance; the threshold should be fixed before looking at the results.
What is the minimum track record length?
The number of observations needed for the probabilistic Sharpe ratio to exceed a chosen confidence level. It grows when returns are skewed or fat-tailed.
Who created the deflated Sharpe ratio?
David H. Bailey and Marcos López de Prado, in The Deflated Sharpe Ratio (Journal of Portfolio Management, 2014).
Sources
Bailey and López de Prado (2014). The Deflated Sharpe Ratio: Correcting for Selection Bias, Backtest Overfitting, and Non-Normality. Journal of Portfolio Management 40(5), 94-107.
Bailey and López de Prado (2012). The Sharpe Ratio Efficient Frontier. Journal of Risk 15(2), 3-44.
Harvey, Liu and Zhu (2016). … and the Cross-Section of Expected Returns. Review of Financial Studies 29(1), 5-68.
White (2000). A Reality Check for Data Snooping. Econometrica 68(5), 1097-1126.
In the library
Deflation vs Selection Bias
Backtest overfitting in ML strategy search (deflated Sharpe)
Hot Hand and Streak Selection Bias (Gilovich-Vallone-Tversky, Miller-Sanjurjo)
Related
Probability of backtest overfitting
Overfitting in trading
Sharpe vs Sortino ratio in backtests
Minimum track record length