Backtesting a Value-at-Risk Model: Counting and Clustering
How can observed loss exceptions test a value-at-risk model?
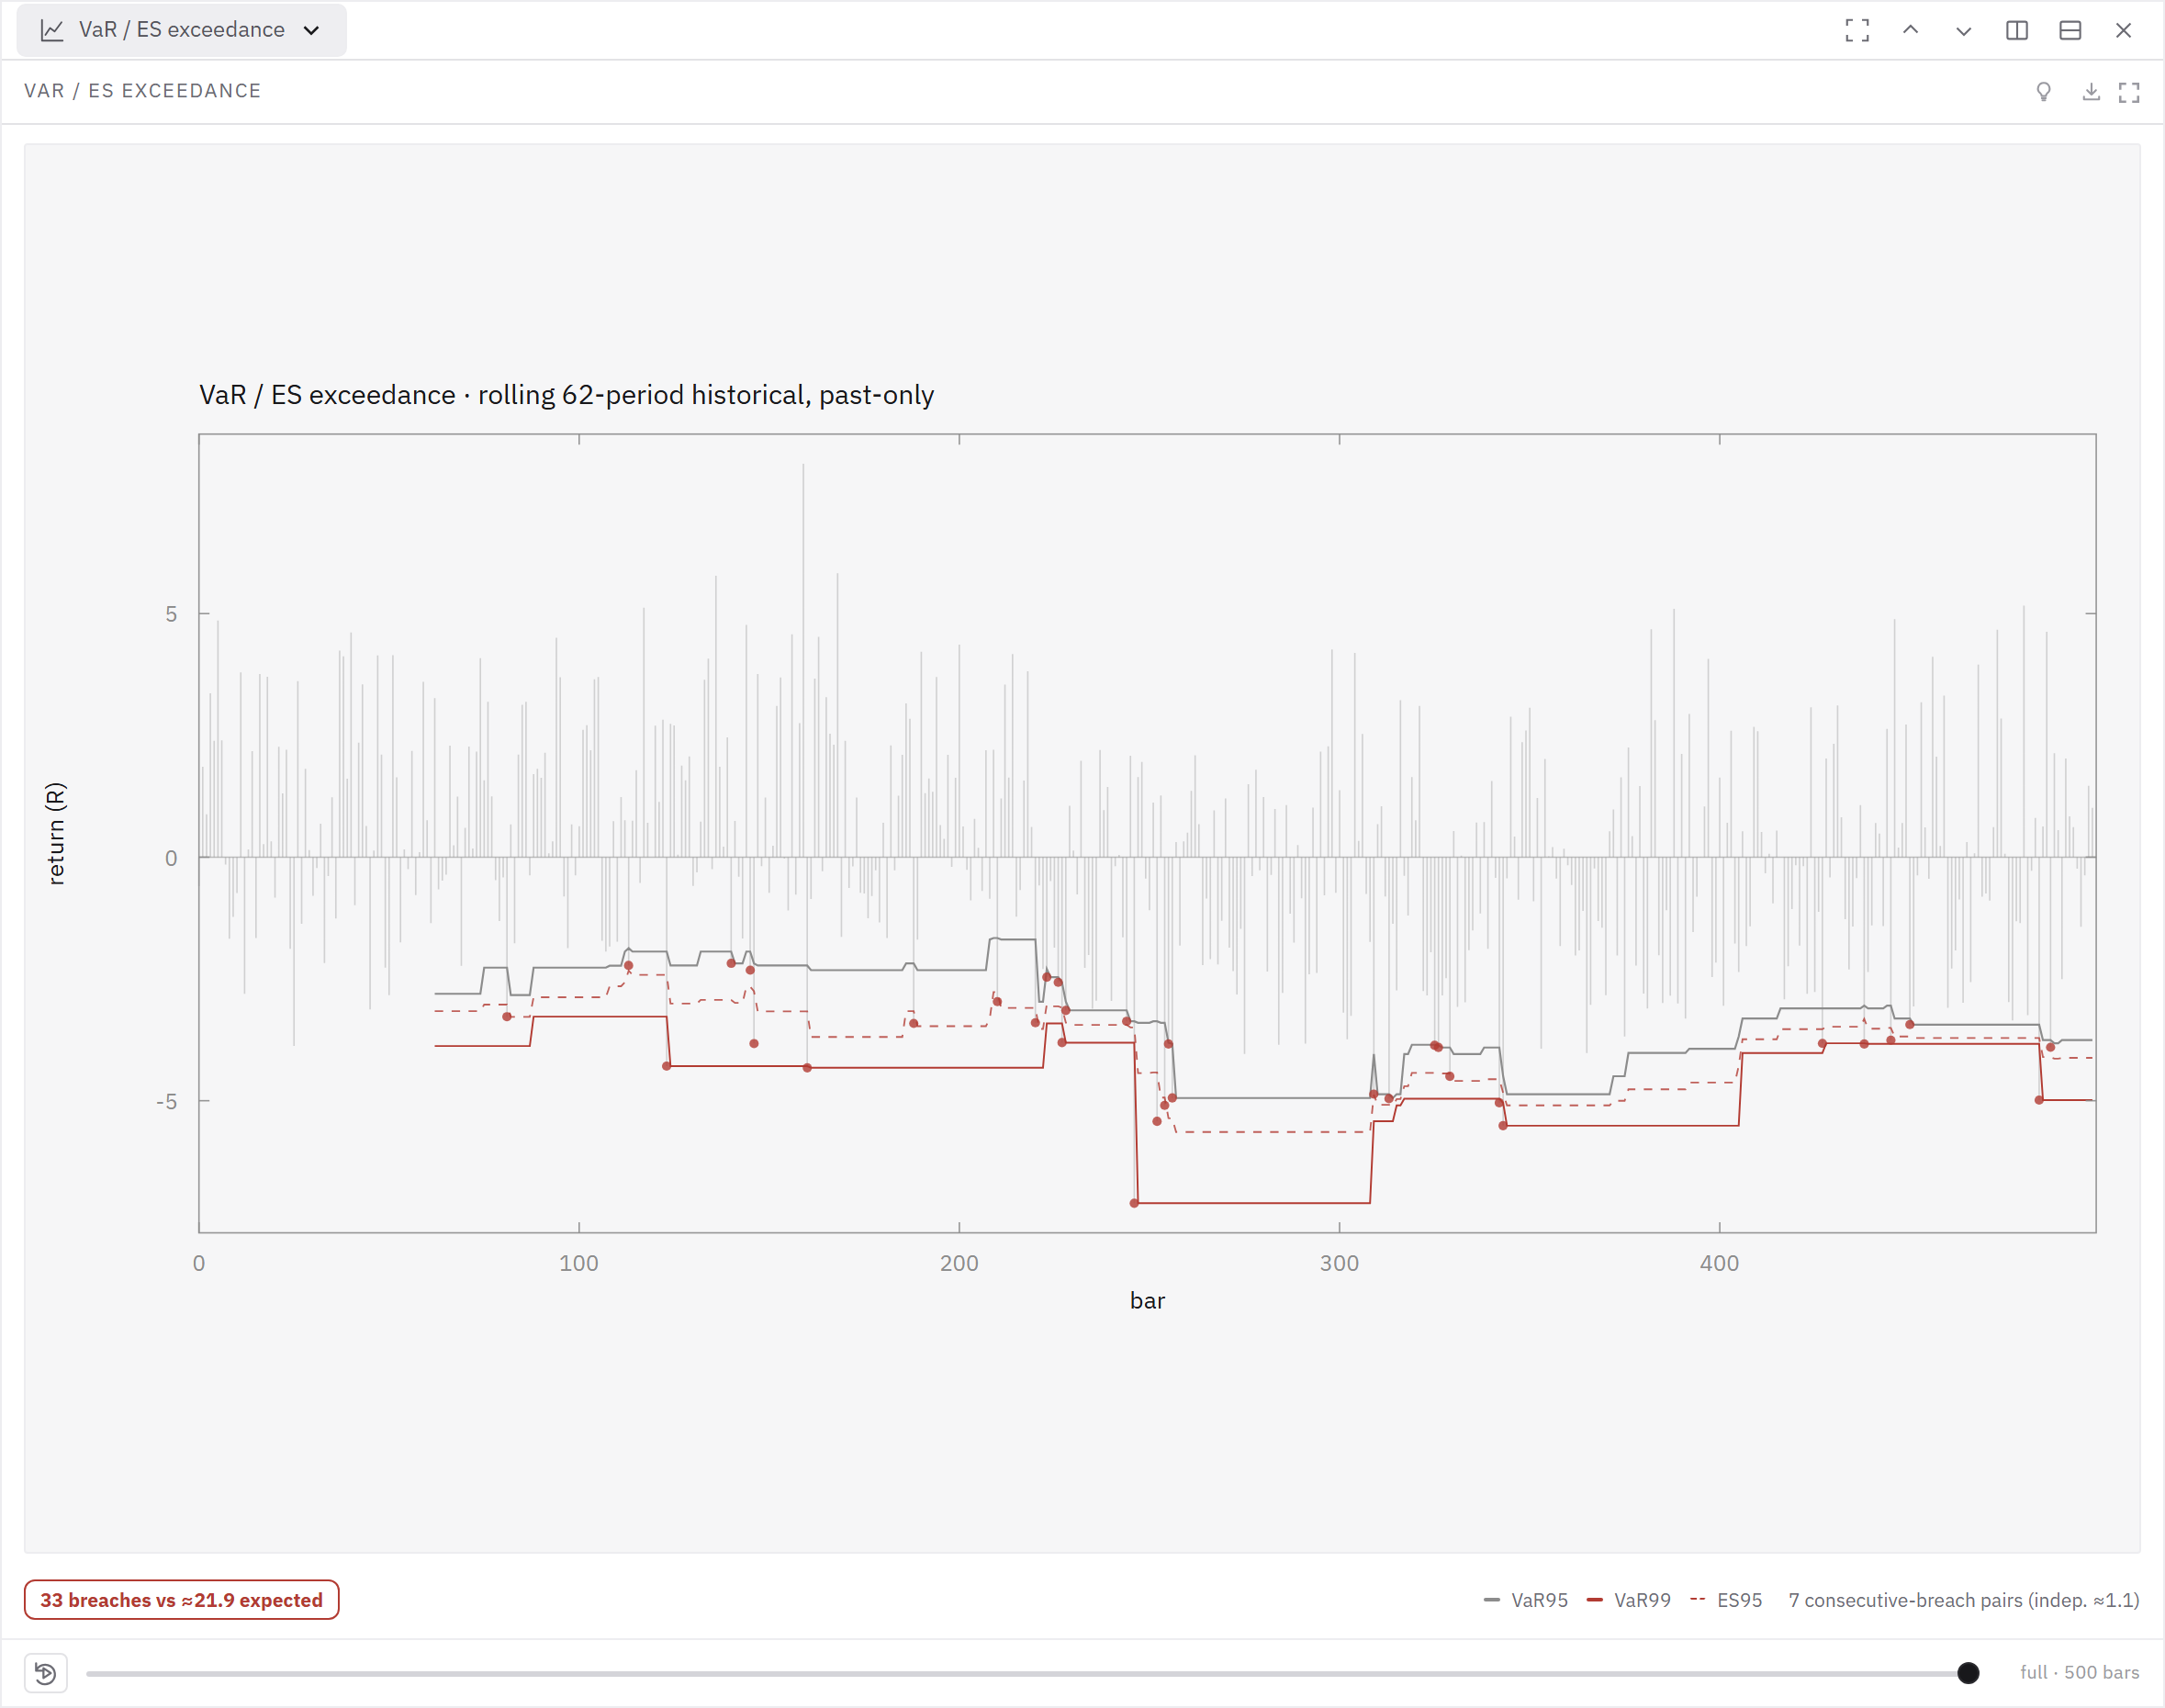
Count realized losses beyond the stated VaR threshold and compare their frequency with the model?s nominal exception rate. Then inspect whether exceptions cluster. A failed independence check signals misspecification, but clustering alone does not identify its cause.
Kupiec coverage and Christoffersen independence are distinct checks; clustered exceptions do not uniquely identify a slow volatility model.
Evidence map
| Aspect | Finding |
|---|---|
| What it is | The two tests that turned risk model validation from a matter of judgement into a procedure. |
| Key result / formula | Kupiec's test addresses the count. If a threshold is meant to be exceeded with a stated probability, then over a sample the number of exceedances follows a binomial distribution, and a likelihood ratio test compares the observed count with the expected one. |
| Why it matters for backtesting | Stochastly computes risk measures and a user will want to know whether to trust them, and this pair supplies the procedure. |
What it is
A risk measure that is exceeded too often is wrong; a risk measure whose exceedances arrive in clusters is also wrong, even when the total count is right, and the two failures require separate tests.
Key result / formula
The paper also computes the test's power, and the uncomfortable finding is that it is low: with a strict threshold the expected number of exceedances is small, so a badly calibrated model can survive a sample of realistic length. Christoffersen adds the second dimension. Correct coverage is necessary but not sufficient; exceedances should also be independent through time, since a model that is right on average but fails during each turbulent period is useless precisely when it is needed. He builds a test of independence based on the transition between exceedance and non-exceedance states, and combines it with the coverage test into a joint statistic, so that a model must pass both to be accepted.
Why it matters for backtesting
Both tests are implementable on the strategy's own return series: count the periods in which the realised loss exceeded the modelled threshold, compare with the expected count, then examine whether those periods cluster. Clustering is the finding that matters most here, because it is the signature of a volatility model that adapts too slowly, and it maps directly onto what a user experiences as a sequence of bad days rather than one. The power warning should travel with the result: a sample that produces no more than a handful of exceedances cannot discriminate between a good model and a poor one, which is another instance of a negative result needing its floor (see [A negative result is worthless without its floor]).
Source
Kupiec, "Techniques for Verifying the Accuracy of Risk Measurement Models", Journal of Derivatives 3(2), 1995, 73-84; Christoffersen, "Evaluating Interval Forecasts", International Economic Review 39(4), 1998, 841-862. Primary source