Transaction costs and slippage
How do spread, slippage, fees, and market impact change a trade?s net return?
In the synthetic example, a 0.4 percent gross trade loses 0.1 percent on each side to spread, fees and slippage, leaving 0.2 percent. Actual costs require market-specific quotes, order sizes and execution conditions.
The cost percentages are synthetic; replace them with measured market and order costs.
A signal's gross return excludes the cost of reaching a position. Net backtest returns require an execution assumption for each entry and exit.
Separate the cost channels
Commission is a stated fee. Spread is the difference between the bid and ask. Slippage is a fill-price deviation from the chosen reference price; market impact can make that deviation size dependent. Perold's implementation shortfall compares an investment decision with its executed result.
A round-trip calculation
Suppose a trade earns 0.40% before costs. Assume a commission of 0.05%, spread allocation of 0.02% and slippage of 0.03% on each of its two fills, all expressed against the same notional. Total modeled cost is 2 × (0.05% + 0.02% + 0.03%) = 0.20%. Net return is 0.40% - 0.20% = 0.20%. Do not add the full spread twice if a fill model already includes it.
Net return = gross return - sum(fill commissions + fill spread allocation + fill slippage)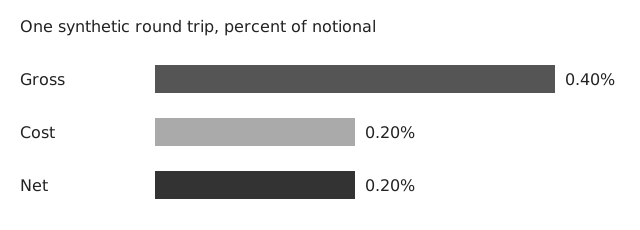
Sensitivity and capacity
Run a range of plausible fill assumptions and report turnover. A fixed percentage cannot represent changing liquidity or order size. Novy-Marx and Velikov measured how trading costs alter the performance of anomaly strategies; their estimates are sample-specific, not default parameters for another market.
In Stochastly
The desktop reality-check path accepts spread and slippage parameters and can run a more adverse fill profile. The result depends on the supplied profile and market data. It does not certify that an order could have filled at the modeled price.
Frequently asked questions
Is spread the same as slippage?
Spread is a quoted bid-ask difference. Slippage compares an assumed or actual fill with a reference price.
Should costs be applied to entries and exits?
Yes. Count each fill and avoid counting a spread component twice.
Does a positive net backtest establish capacity?
No. Capacity needs size-sensitive liquidity and impact evidence beyond a fixed fill assumption.
Sources
Perold (1988). The Implementation Shortfall: Paper versus Reality. Journal of Portfolio Management 14(3), 4-9.
Novy-Marx and Velikov (2016). A Taxonomy of Anomalies and Their Trading Costs. Review of Financial Studies 29(1), 104-147.
Arnott, Harvey and Markowitz (2019). A Backtesting Protocol in the Era of Machine Learning. Journal of Financial Data Science 1(1), 64-74.
In the library
Are Momentum Profits Robust to Trading Costs? The Capacity Question
Implementation Shortfall: Paper Portfolio versus Real Portfolio (Perold)
No-Dynamic-Arbitrage Constrains the Shape of Market Impact (Gatheral)
Market Impact (Almgren-Chriss & the Square-Root Law)
Transaction Costs & Why Low-Frequency Edges Survive
Related
How to backtest a trading strategy
Transaction costs and low-frequency edges