Extreme Value Theory for Tail Risk
How should a risk estimate treat observations beyond its ordinary tail threshold?
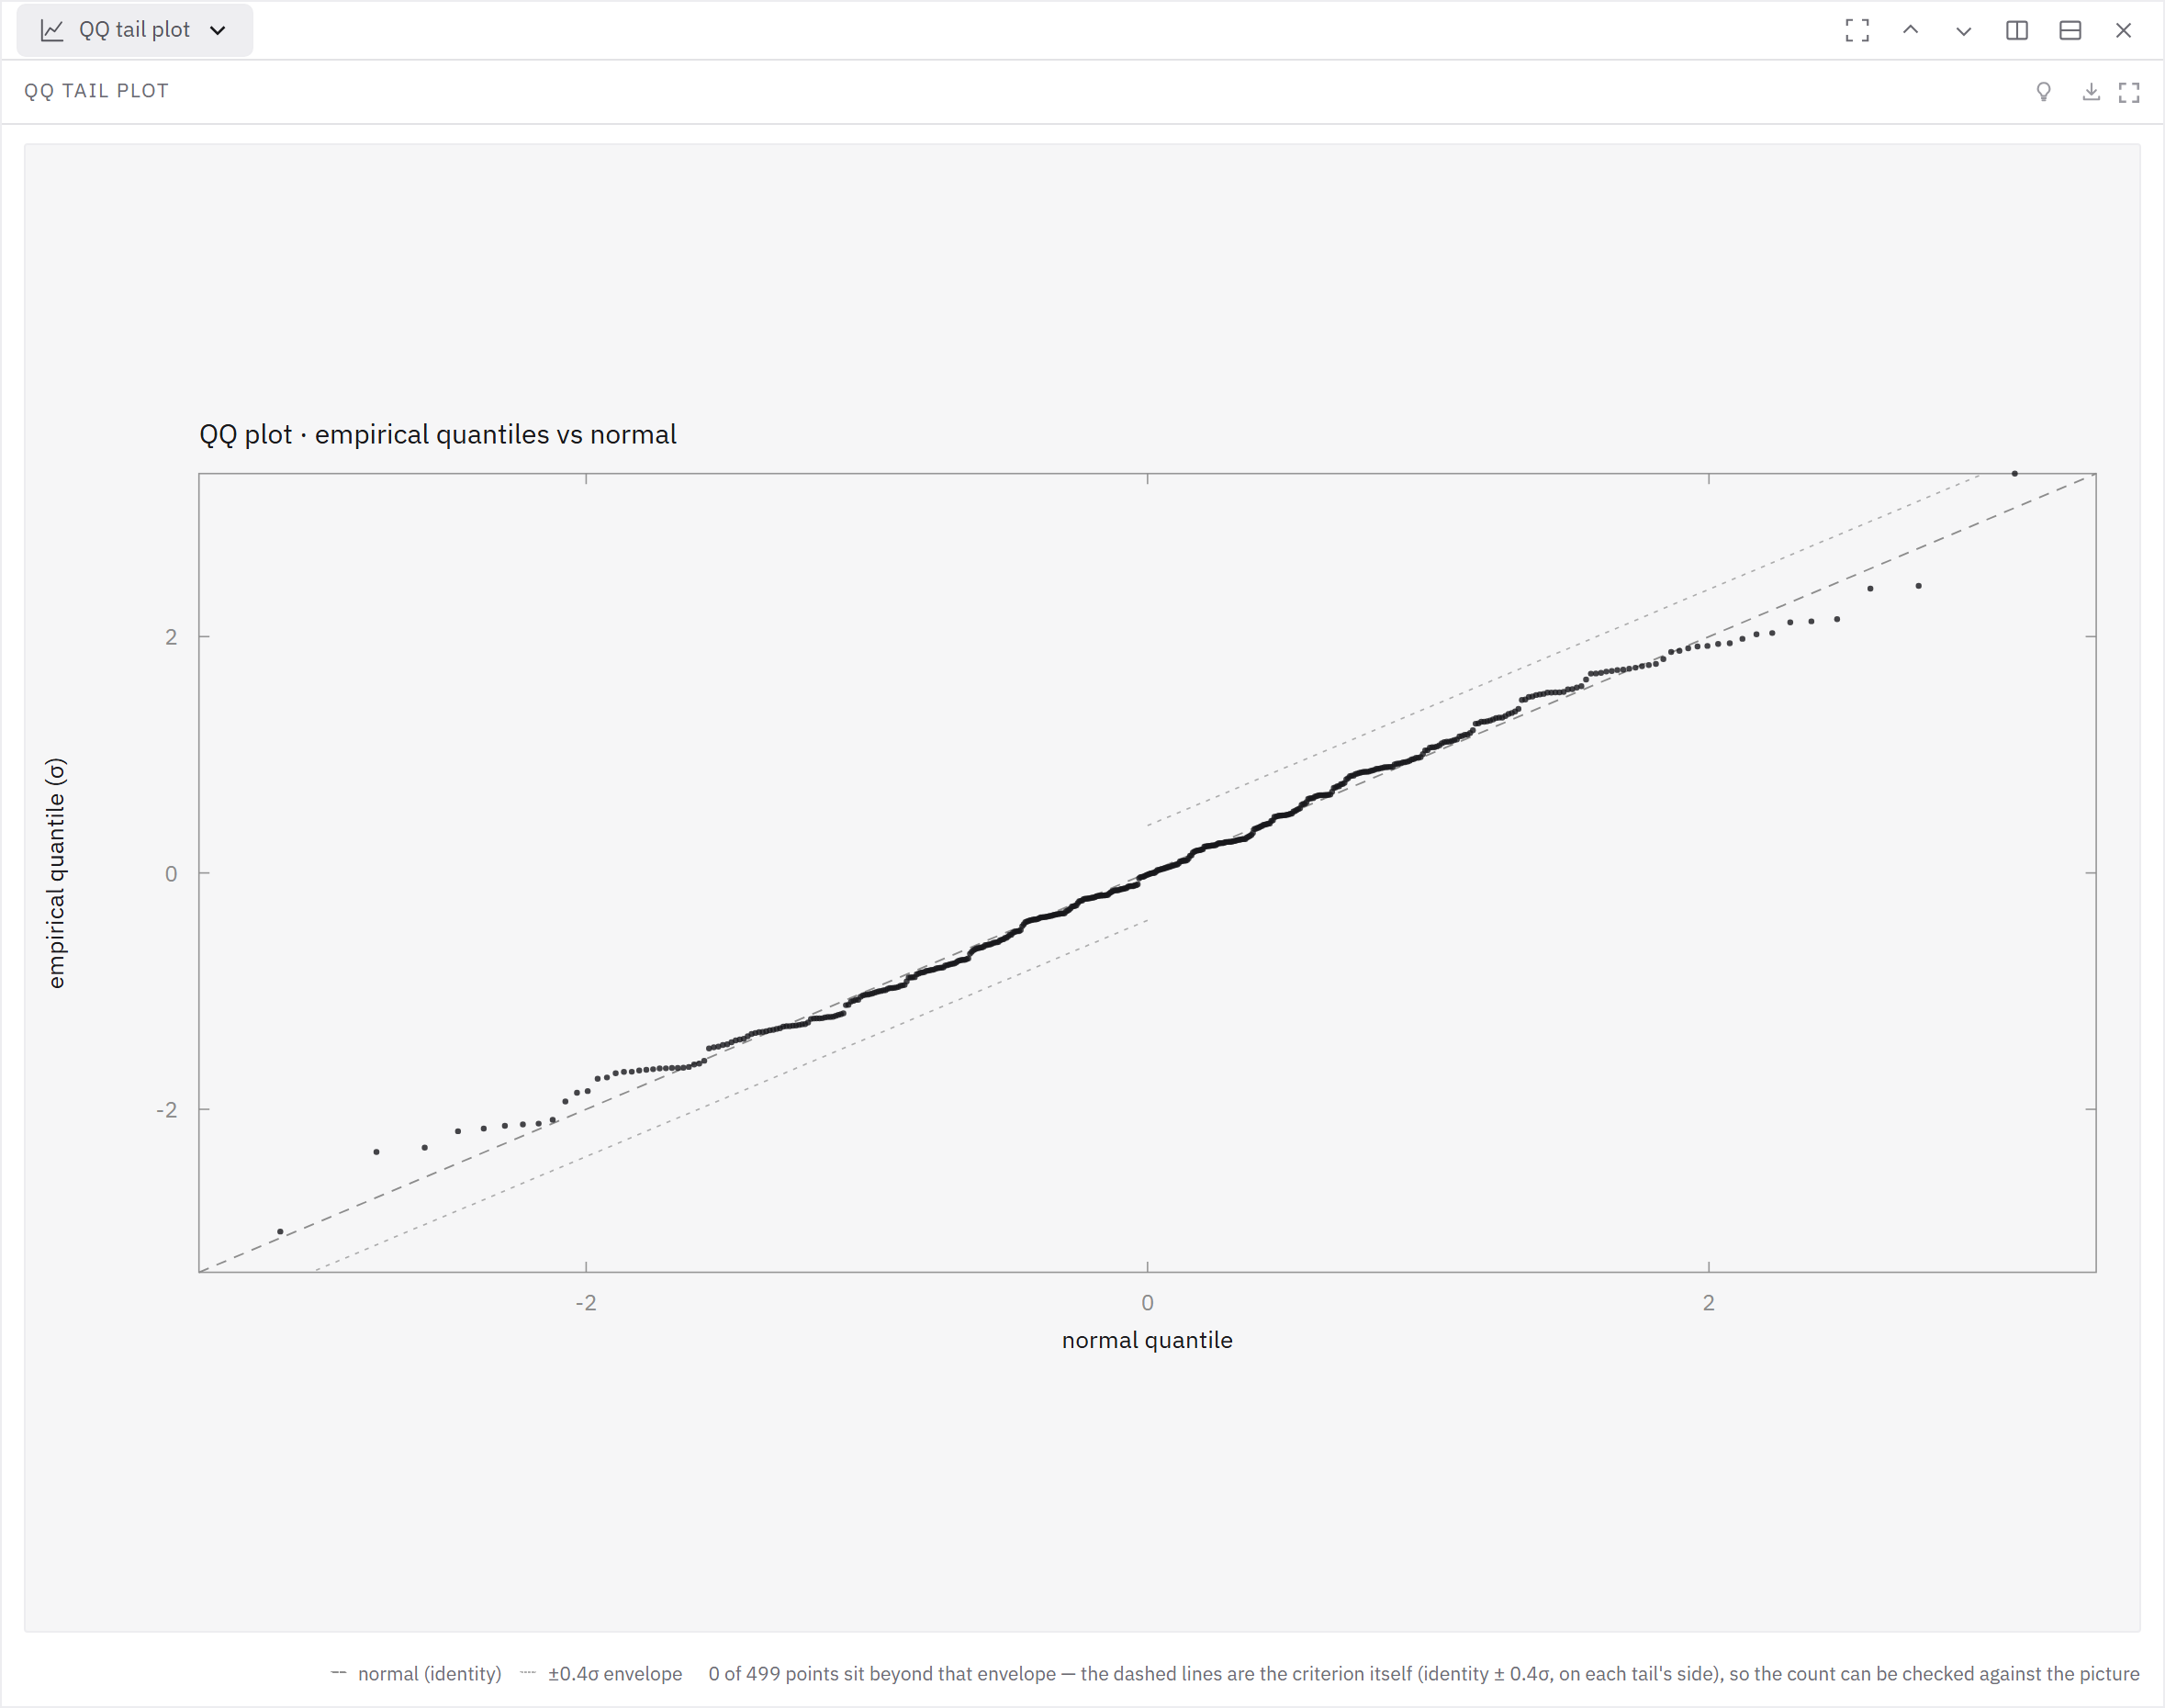
Choose a tail threshold, fit the exceedances under an explicit tail model, and check threshold sensitivity and held-out exceedance frequency. Extrapolation beyond observed losses depends on those assumptions; a previously unseen crisis is not validated by the fit.
Tail extrapolation depends on threshold and model assumptions; an unseen crisis is not validated.
Evidence map
| Aspect | Finding |
|---|---|
| What it is | The branch of statistics that models the distribution of the largest observations rather than the full sample. |
| Key result / formula | Two equivalent formulations. Block maxima converge to the generalised extreme value distribution (Fisher-Tippett-Gnedenko). |
| Why it matters for backtesting | Historical value-at-risk cannot see beyond the largest loss in the sample, and drawdown limits are breached precisely by events that have no precedent in it. |
What it is
It supplies the tool for estimating losses beyond anything in the historical record — the quantity each risk limit implicitly assumes.
Key result / formula
Exceedances over a high threshold converge to the generalised Pareto distribution (Pickands-Balkema-de Haan), with shape parameter ξ and scale β: for ξ > 0 the tail is heavy and moments above order 1/ξ do not exist. The Hill estimator gives ξ from the largest order statistics. Empirical studies of equity and index returns typically estimate ξ > 0 with a tail index in the low single digits, which would mean variance exists while kurtosis sits at the edge of existence — enough to make sample kurtosis unstable and any Gaussian risk figure optimistic. Treat that as a range reported across markets and periods; it is not a constant: the Hill estimator is famously sensitive to how many order statistics you keep, so estimate it on your own series and plot it against that choice before believing a number. McNeil & Frey (2000) combine a GARCH filter with EVT on the standardised residuals, which is the standard way to obtain a conditional tail estimate.
Why it matters for backtesting
EVT gives a principled extrapolation with a realistic confidence band — usually a wide one, which is itself the finding. The threshold choice is the practitioner's burden: too high leaves too few exceedances, too low breaks the asymptotic justification, so report the estimate across a range of thresholds, with its sensitivity to that choice.
Source
Embrechts, Klüppelberg & Mikosch, Modelling Extremal Events for Insurance and Finance, Springer 1997; Hill, Annals of Statistics 3(5), 1975; McNeil & Frey, "Estimation of Tail-Related Risk Measures for Heteroscedastic Financial Time Series", Journal of Empirical Finance 7(3-4), 2000. Primary source