The Standard Error of a Sharpe Ratio, and What Autocorrelation Does to It
How uncertain is a Sharpe estimate when returns are serially correlated?
When returns are serially correlated, both the uncertainty of an estimated Sharpe ratio and its annualization change. Report the sampling frequency and autocorrelation, then use a variance estimate compatible with that dependence.
The simple square-root annualization applies under independent returns; serial correlation changes the scale.
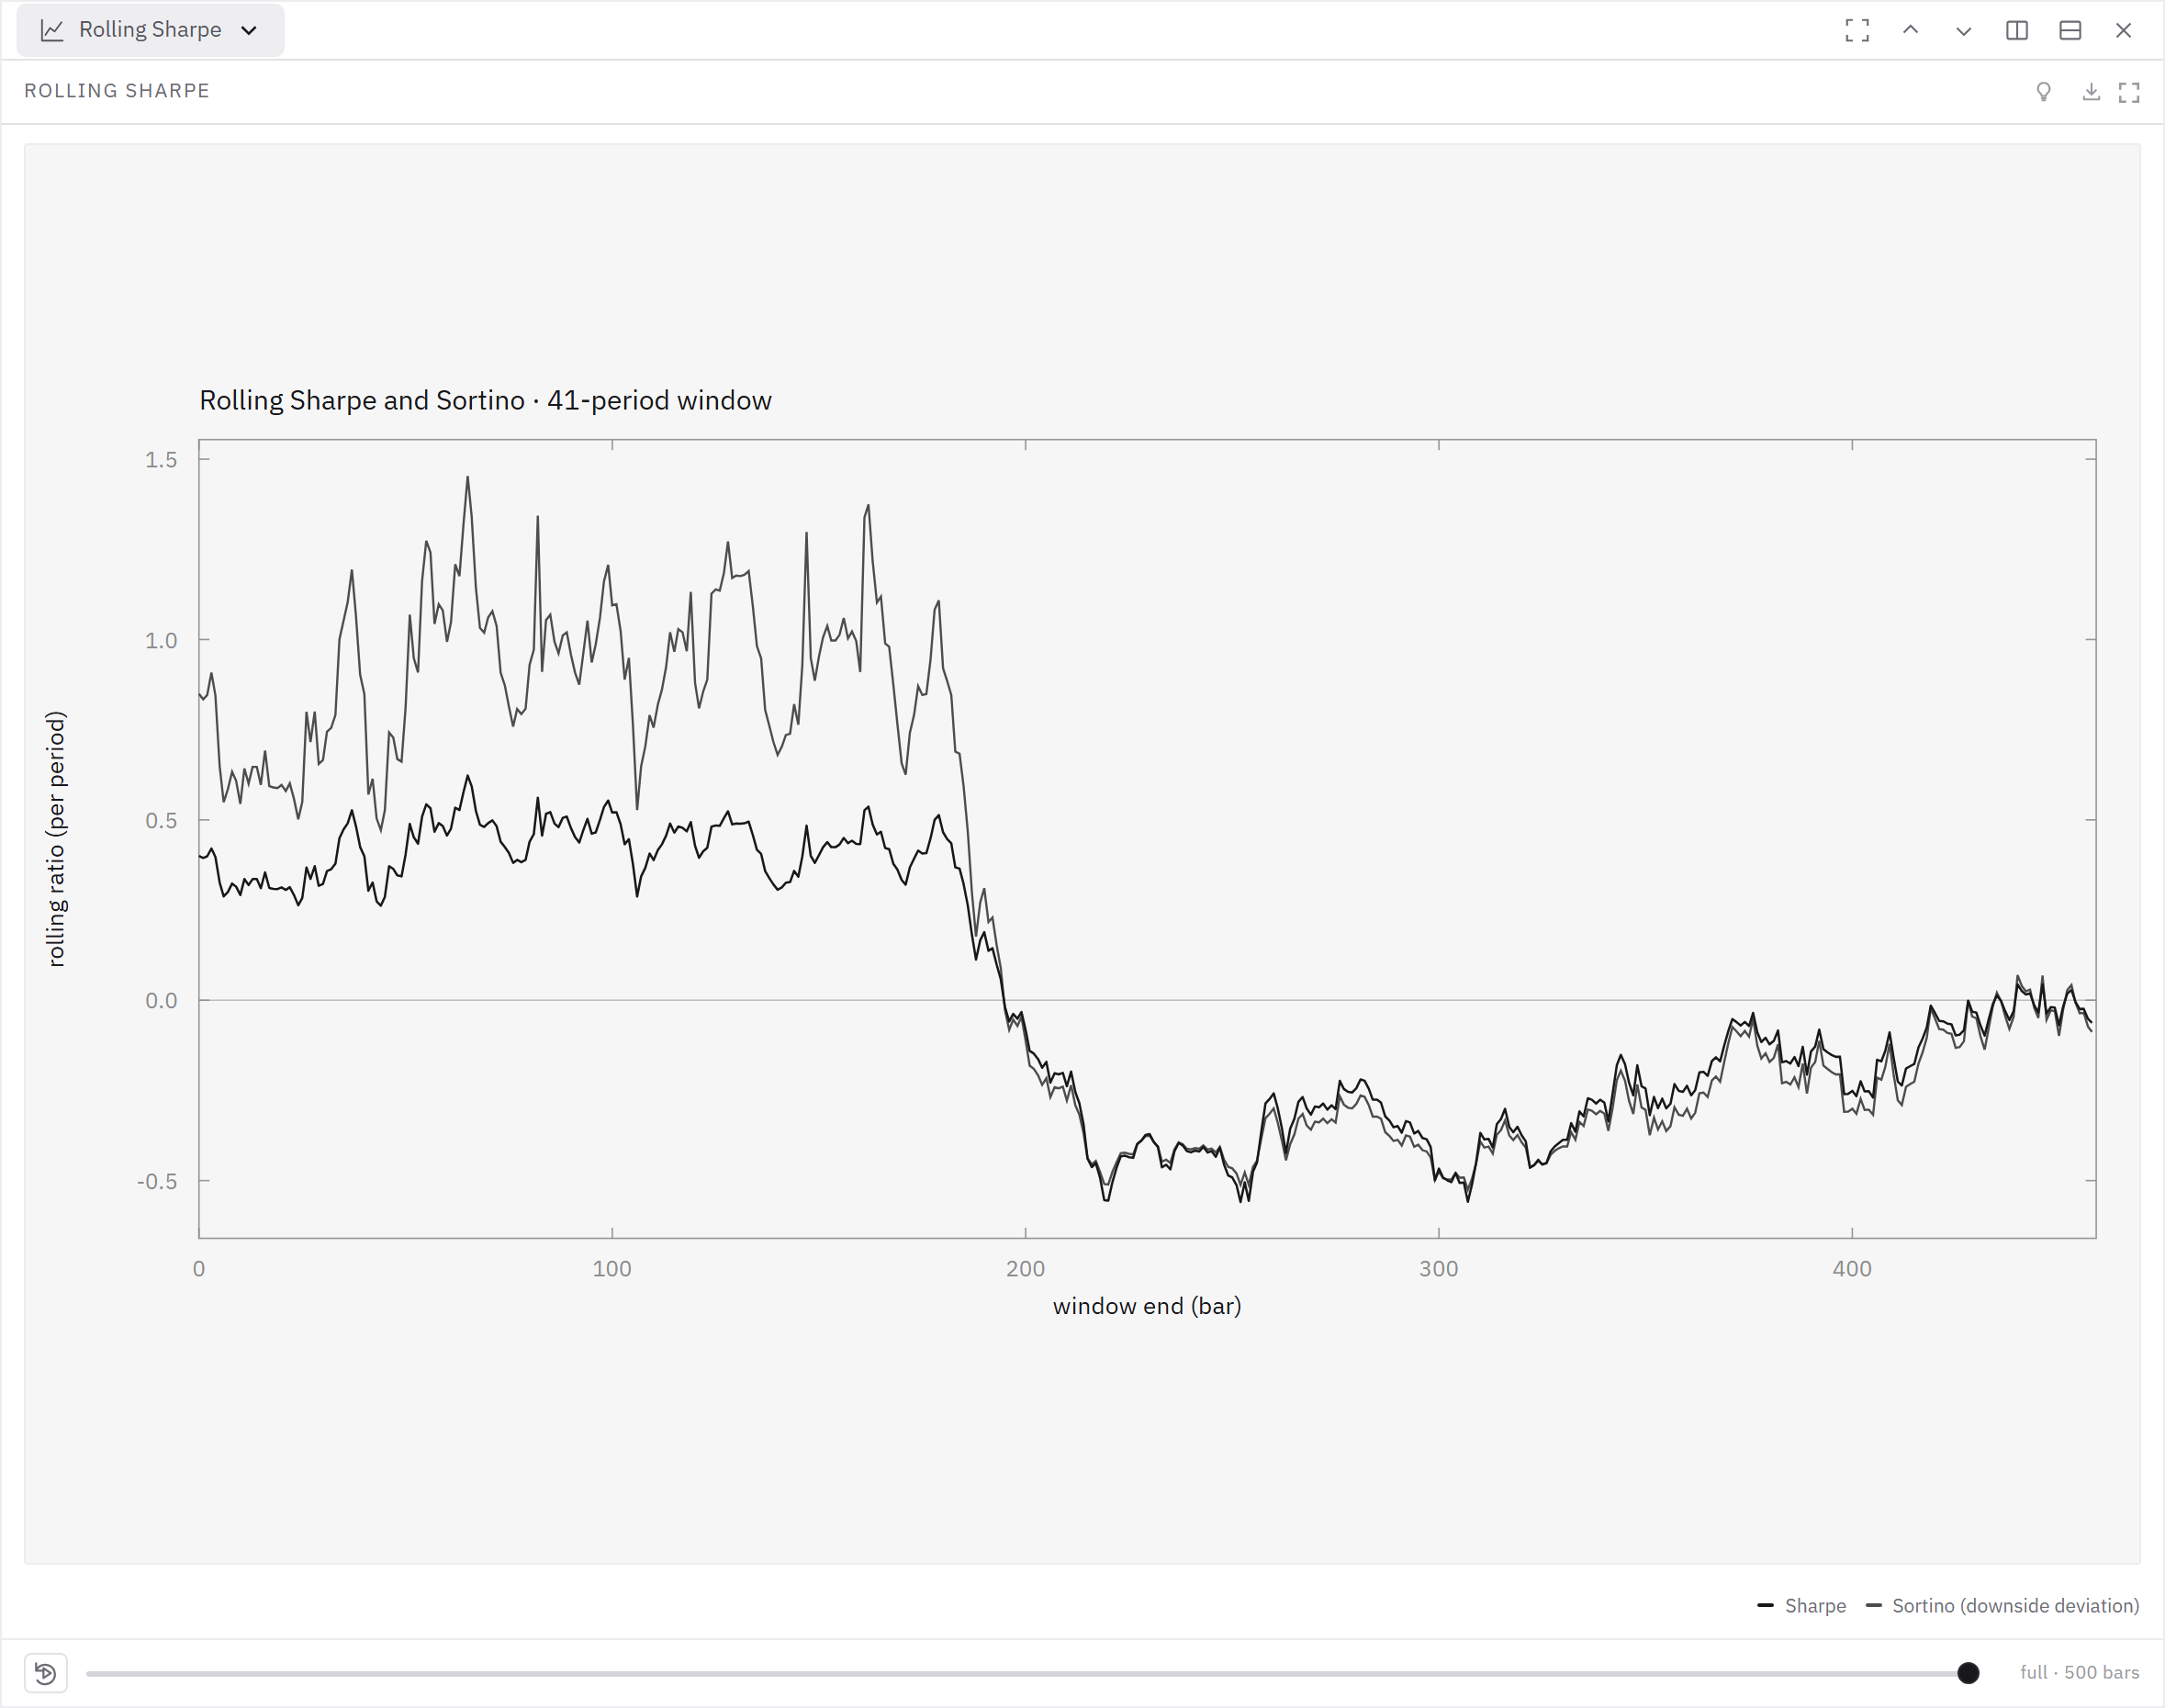
Evidence map
| Aspect | Finding |
|---|---|
| What it is | A Sharpe ratio is an estimate with a sampling distribution. |
| Key result / formula | For i.i.d. returns, the asymptotic standard error of the estimated Sharpe is approximately sqrt((1 + SR²/2)/T) per period. |
| Why it matters for backtesting | Two consequences follow. First, short track records give Sharpe estimates whose standard error is comparable to the quantity itself, so ranking strategies on a small sample ranks noise; this is the same arithmetic that drives the Minimum Track Record Length. |
What it is
Lo (2002) derives its standard error, shows how the familiar square-root-of-time annualisation fails when returns are autocorrelated, and gives the correct scaling.
Key result / formula
Under non-normality it depends on skewness and kurtosis (the correction that the Probabilistic Sharpe Ratio builds on). For annualisation, the naive factor sqrt(q) applied to a q-period aggregation is valid only under independence; with autocorrelations ρ_j the correct factor is q / sqrt(q + 2·Σ_{j=1..q-1} (q − j)·ρ_j). Positive autocorrelation makes the naive factor overstate the annualised Sharpe — sometimes substantially, as for illiquid or smoothed return series — while negative autocorrelation understates it.
Why it matters for backtesting
Second, any strategy whose P&L is smoothed — slow-turnover books, marks that lag, positions held through gaps — reports an annualised Sharpe that is mechanically flattered. Report the estimate together with its standard error, and state the autocorrelation of the return series alongside it.
Worked precision
If an annualized Sharpe is estimated from one year of independent daily returns, its uncertainty is much larger than the printed two-decimal value suggests. Positive return autocorrelation reduces the effective number of independent observations; annualizing by sqrt(252) without a serial-correlation correction can overstate performance. Estimate lag autocovariances or use a block bootstrap on complete returns, then show an interval for the Sharpe. For example, doubling the number of independent years roughly reduces a standard error by 1/sqrt(2), not by one-half. State the sampling frequency, return convention and cost treatment. A confidence interval around an already selected maximum remains optimistic unless the selection itself is included in the calculation.
Source
Lo, "The Statistics of Sharpe Ratios", Financial Analysts Journal 58(4), 2002, 36-52; Bailey & López de Prado, "The Sharpe Ratio Efficient Frontier", Journal of Risk 15(2), 2012; Getmansky, Lo & Makarov, "An Econometric Model of Serial Correlation and Illiquidity in Hedge Fund Returns", JFE 74(3), 2004. Primary source