The Expected Maximum Drawdown of a Brownian Motion
What drawdown should a random return path produce over a fixed horizon?
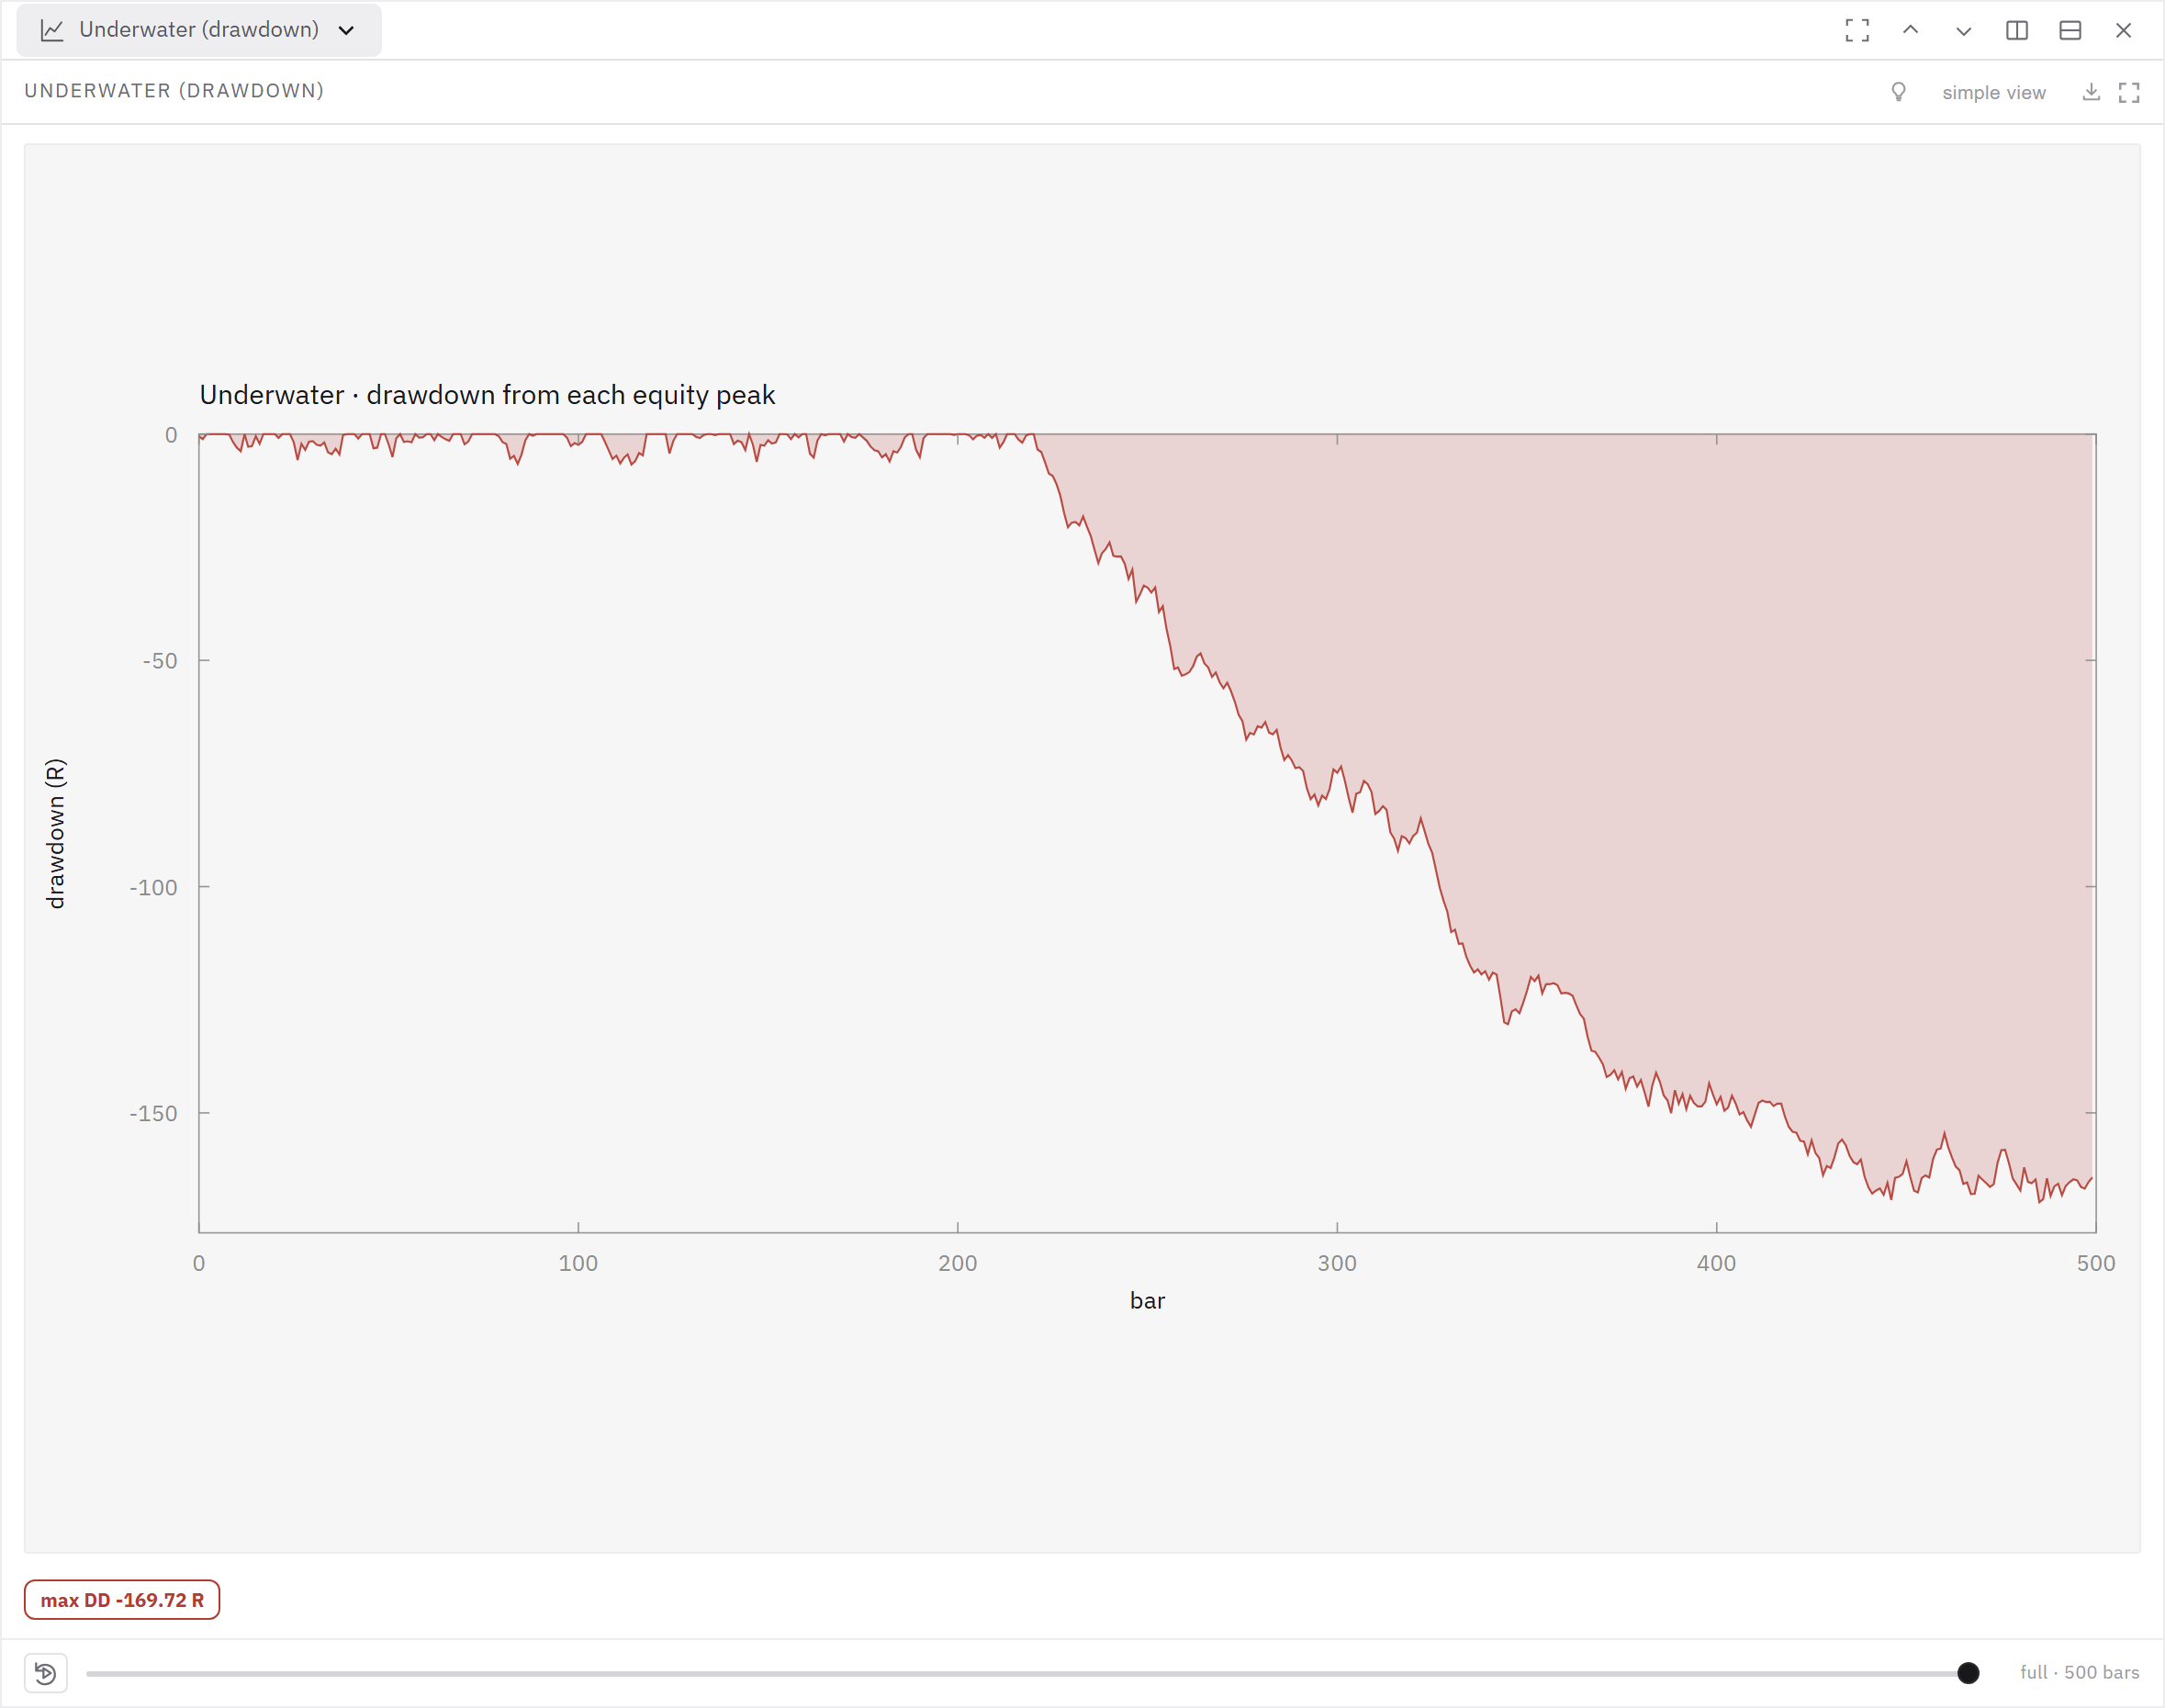
Under a stated Brownian drift, volatility and horizon, the paper describes expected maximum drawdown for that model. Compare the observed path with simulated paths using the same assumptions and monitoring frequency; the expectation alone is not a significance test.
Expected drawdown under Brownian assumptions is descriptive and is not a significance test for a strategy.
Evidence map
| Aspect | Finding |
|---|---|
| What it is | An analytic benchmark for the expected maximum peak-to-trough decline of a Brownian process with specified drift and volatility over a finite horizon. |
| Key result / formula | Magdon-Ismail, Atiya, Pratap and Abu-Mostafa derive expected maximum drawdown as a function of drift, volatility and horizon. |
| Why it matters for backtesting | A user can ask whether a drawdown is large relative to this specified model over the same horizon. |
What it is
It describes that model's average drawdown. An expectation alone does not give the probability of observing any particular drawdown.
Key result / formula
The sign of drift changes the long-horizon scaling in their model: square-root growth with zero drift, approximately logarithmic growth with positive drift and linear growth with negative drift. This matters when comparing tests of different length. An otherwise unchanged Brownian process can produce a larger maximum drawdown simply because it was observed for longer. The analytic benchmark can put two horizons on a common scale, provided that drift, volatility and the Brownian assumptions are stated. Estimating drift from the same period whose maximum drawdown is being judged adds uncertainty and selection that the closed-form expectation does not remove.
Why it matters for backtesting
The expected value supplies a descriptive reference. To estimate how unusual an observed drawdown is, calculate or simulate a distribution of maximum drawdowns under a predeclared null and compare the observation with that distribution. Include uncertainty in the fitted drift and volatility. The question "Is the strategy broken?" needs another test: a model can change, costs can rise, or a large drawdown can occur under an unchanged process. A change detector and later observations are needed before attributing a cause. A model that preserves heavy tails or volatility clustering can test sensitivity beyond the Brownian assumptions, but its null construction and data window must be declared. The Brownian expectation remains a scale check, not a pass/fail verdict.
Worked comparison
Suppose two strategies have the same estimated daily drift and volatility, but one is observed for two years and the other for eight. Comparing their raw maximum drawdowns directly penalizes the longer record for having more time to encounter a decline. Evaluate both over a common horizon, or report each drawdown beside the model expectation for its own horizon. This does not make either strategy reliable: the return process may change, and a single expectation does not describe tail probability. Keep the chosen model and sample split visible.
Source
Magdon-Ismail, Atiya, Pratap & Abu-Mostafa, "On the Maximum Drawdown of a Brownian Motion", Journal of Applied Probability 41(1), 2004, 147-161. Primary source