Managing Diversification: How Many Bets Are You Actually Making
How many independent portfolio bets remain after accounting for shared risk factors?
Decompose portfolio risk under a declared factor basis and calculate each factor?s contribution before counting effective bets. The count changes when the decomposition or covariance estimate changes, so report both choices and test stability on another period.
Effective-bet counts depend on factor decomposition and its chosen risk representation.
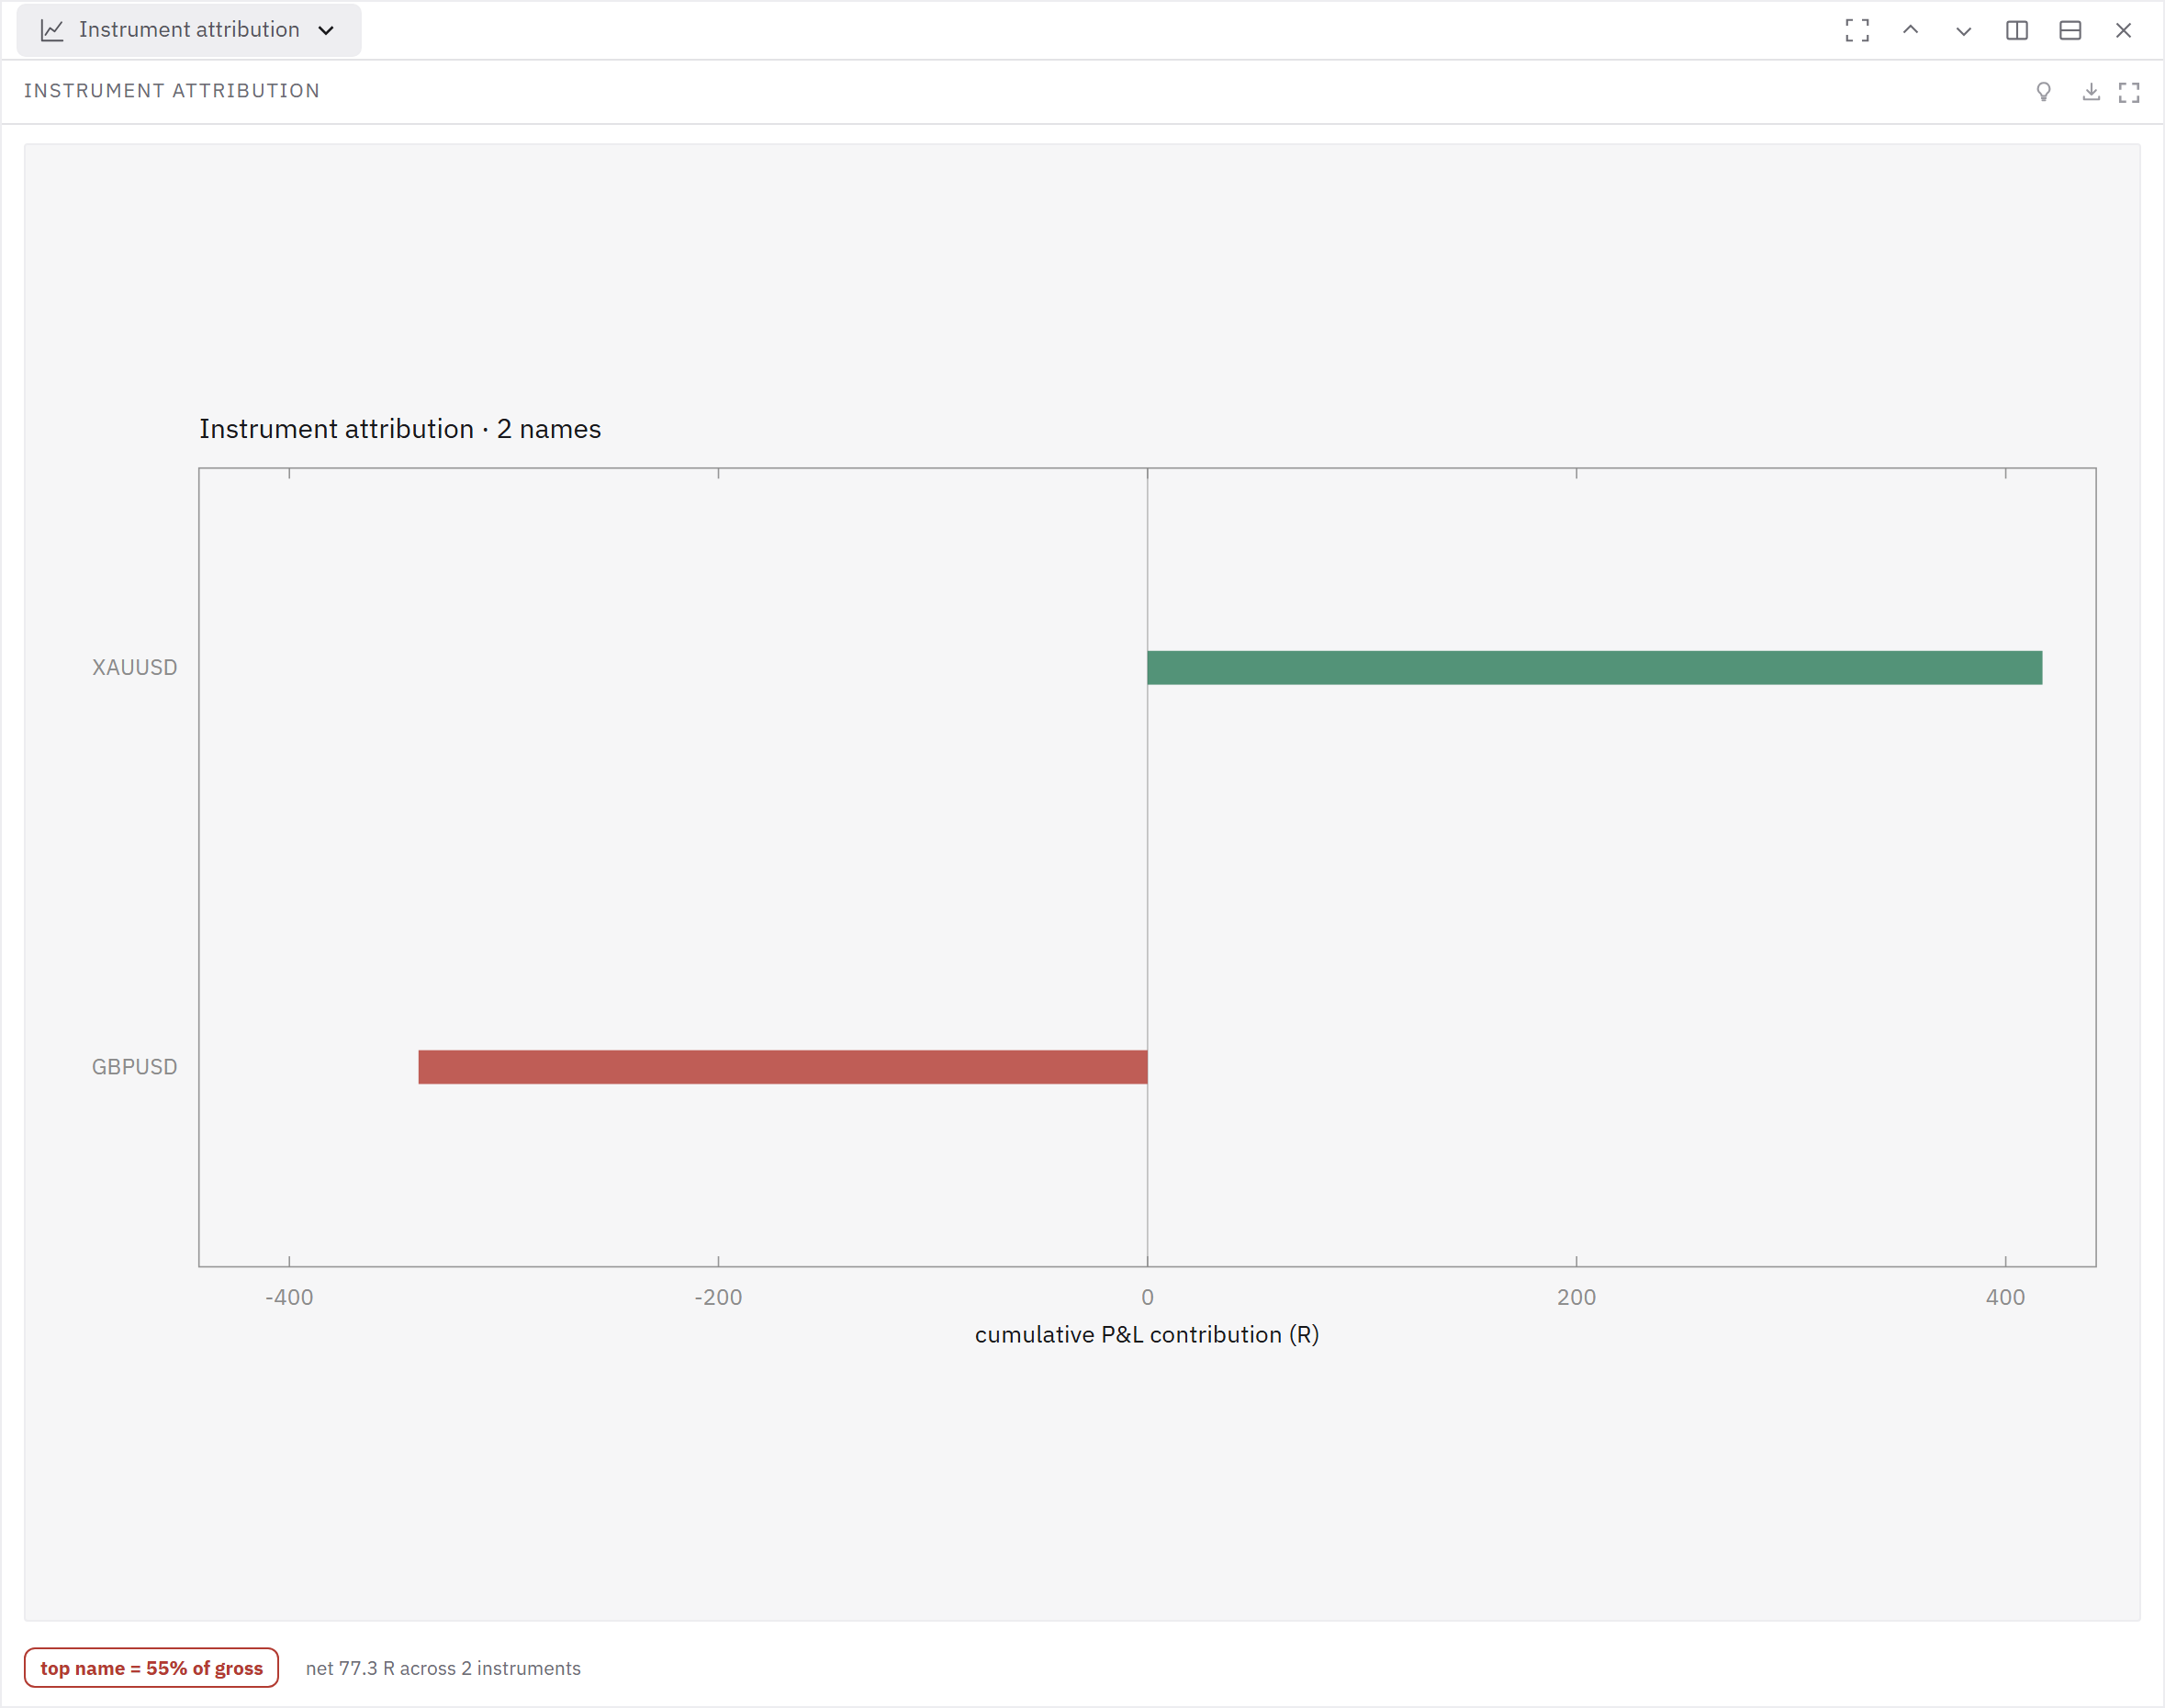
Evidence map
| Aspect | Finding |
|---|---|
| What it is | Meucci's construction of a number that measures how diversified a portfolio really is. |
| Key result / formula | The portfolio's risk is decomposed along the principal components of the covariance matrix, which are uncorrelated by construction, and the share of total variance attributable to each is computed. |
| Why it matters for backtesting | This gives an agent a concrete reply to "is my portfolio diversified". |
What it is
The count of positions is meaningless when the positions move together, and the correlation matrix is hard to read directly; this turns both into a single interpretable quantity, the effective number of independent bets.
Key result / formula
Those shares form a distribution, and its concentration is summarised by an entropy-based measure whose exponential is the effective number of bets: a portfolio whose variance is spread evenly across many components has a high number, and one dominated by a single component has a number close to one however many positions it holds. Meucci then proposes managing the portfolio against that quantity directly, maximising it subject to constraints, which produces allocations that differ from those obtained by minimising variance. The important interpretive point is that principal components are statistical constructs without economic meaning, so the number measures the diversification of risk rather than of exposures, and it changes when the covariance estimate changes.
Why it matters for backtesting
It is computable on the user's own return series and it is far more informative than the count of instruments or a glance at a correlation matrix: a user holding several strategies on correlated instruments typically discovers that their effective number of bets is close to one, which explains a drawdown that felt worse than expected. The diagnostic pairs with the existing note on factor exposure (see [The Factor Exposure Map: Low Cross-Correlation Does Not Mean No Common Exposure]), which identifies what the common component is, while this one measures how much of the risk it carries. Both should be recomputed on the recent window as well as the full sample, since the effective number typically collapses in stressed periods, which is when it matters.
Source
Meucci, "Managing Diversification", Risk 22(5), May 2009, 74-79. Primary source