Pesaran-Timmermann Test of Directional Accuracy
Is a directional hit rate better than the rate implied by the predicted and actual class balances?
Calculate the hit rate and the independence benchmark from actual frequencies of predicted and realized positive signs, then test their difference under a suitable dependence model. A 58 percent hit rate alone is uninformative when upward outcomes already dominate.
The sign-only test does not measure return magnitude; serial dependence and overlapping horizons need separate treatment.
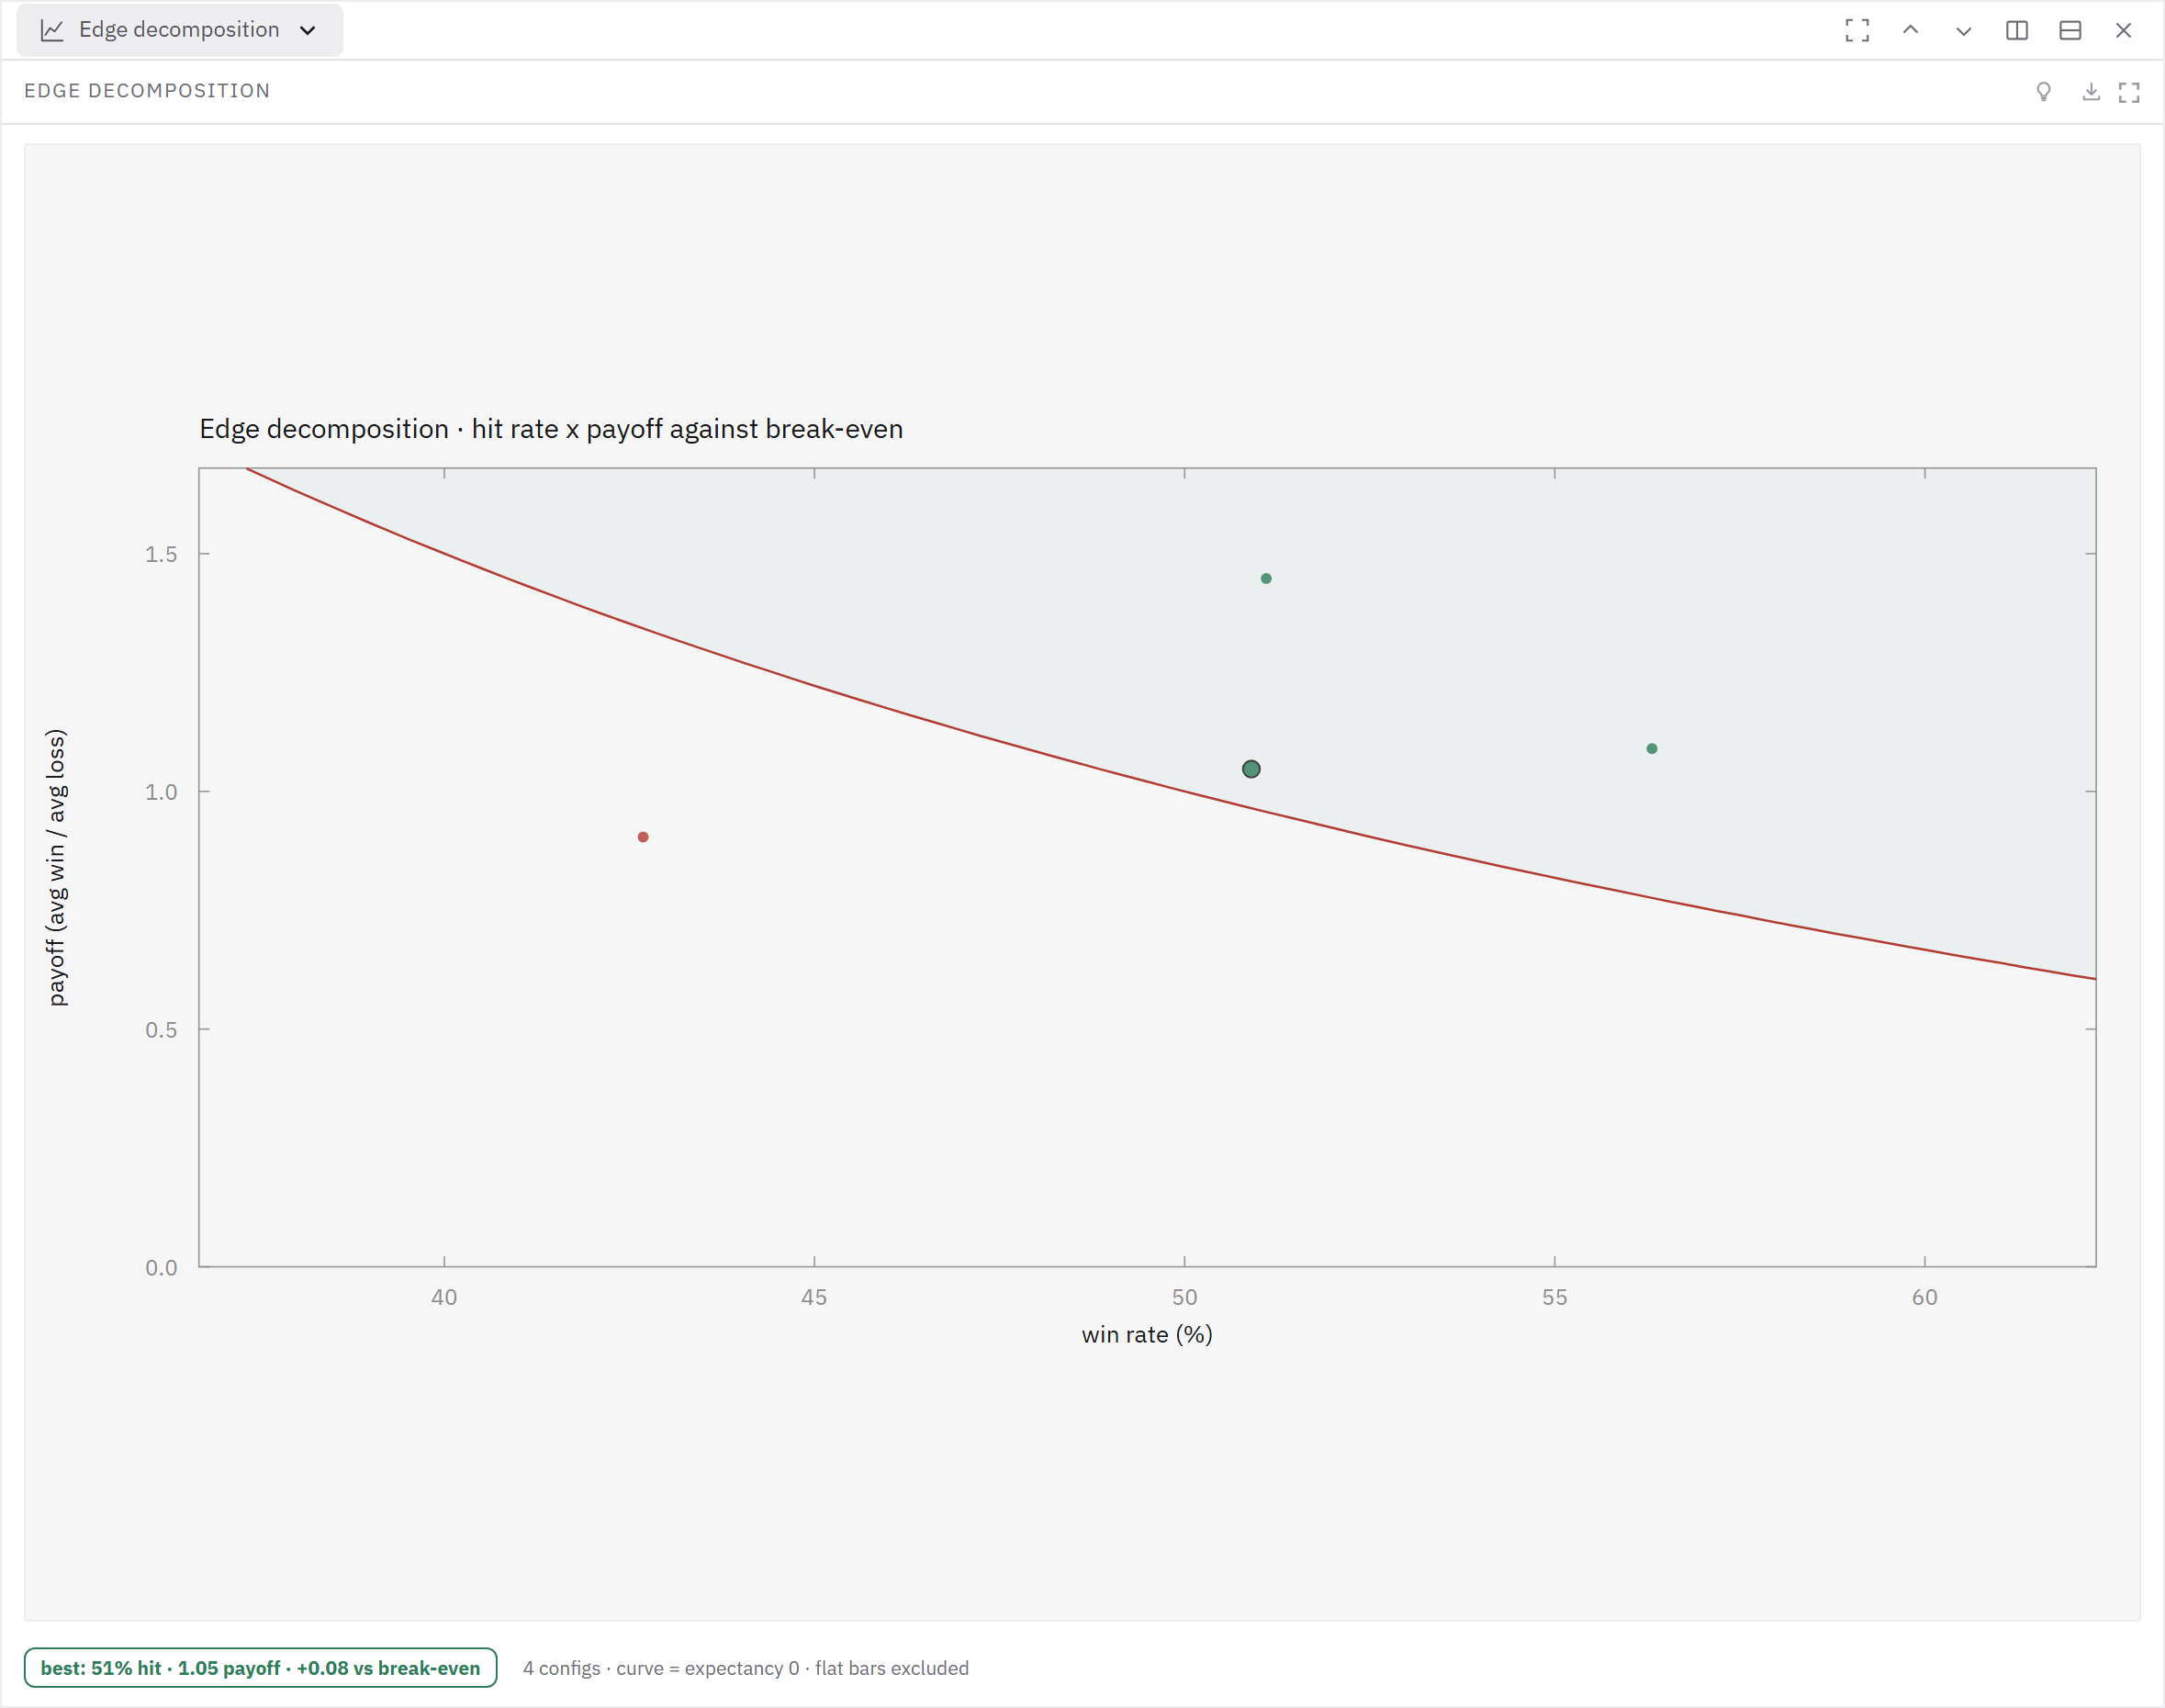
Evidence map
| Aspect | Finding |
|---|---|
| What it is | A nonparametric test of whether a forecast predicts the sign of a variable better than chance, where "chance" accounts for how often the variable and the forecast each go up. |
| Key result / formula | Let P_hit be the proportion of periods in which the forecast sign matched the realised sign. |
| Why it matters for backtesting | A directional forecast can be checked against the observed base rates before interpreting its raw hit rate. |
What it is
It exists because a raw hit rate is meaningless on its own: a forecaster who says "up" unconditionally is right as often as the market rises.
Key result / formula
Under independence of forecasts and outcomes the expected proportion is P_ind = P_y P_x + (1 − P_y)(1 − P_x), where P_y and P_x are the sample frequencies of positive realisations and of positive forecasts. The statistic S_n = (P_hit − P_ind)/√(V(P_hit) − V(P_ind)), with both variances estimated from the same frequencies, is asymptotically standard normal under the null of no predictive power; The authors distinguish their directional-prediction null from the broader contingency-table independence null. Independence implies predictive failure, while the converse need not hold; a chi-square independence test can therefore be more conservative for this question. The test uses signs alone, so it is immune to the scale and the outliers of the returns, which is its strength and its limit: it is silent about magnitude. The derivation assumes independent observations; serial dependence in the realised signs, common in trending bars or with overlapping horizons, invalidates the variance and needs a block-based correction. Power is modest in short samples, and, as with any test on signs, a 52 per cent hit rate over a few hundred bars is indistinguishable from chance.
Why it matters for backtesting
Export aligned forecast signs and realised signs, build the two-by-two table, and calculate the independence benchmark from the actual sample. Then inspect return magnitudes on hits and misses: a high sign accuracy can coexist with losses when misses coincide with large moves. Preserve chronology and forecast horizon when forming the table; overlapping outcomes require a dependence-aware inference method. A simple permutation of individual bars would destroy serial structure and should not be treated as a valid correction without further assumptions. If the adjusted directional evidence is weak, the hit rate alone does not establish an edge. This is an analysis protocol, not a claim that Stochastly currently offers a Pesaran-Timmermann node or report.
Source
Pesaran & Timmermann, "A Simple Nonparametric Test of Predictive Performance", Journal of Business & Economic Statistics 10(4), 1992. Primary source
Related in the library
The Virtue of Complexity Debate: More Parameters Than Observations
Regime Changes in Financial Markets (Ang-Timmermann Review)
Contagion or Interdependence: the Bias That Inflates Crisis Correlations
The Hierarchical Structure of Markets, and What Clustering Adds
How the assistant cites the library · The checks behind a verdict